Chrysler 2013 Annual Report Download - page 58
Download and view the complete annual report
Please find page 58 of the 2013 Chrysler annual report below. You can navigate through the pages in the report by either clicking on the pages listed below, or by using the keyword search tool below to find specific information within the annual report.-
 1
1 -
2
-
3
-
4
-
5
-
6
-
7
-
8
-
9
-
10
-
11
-
12
-
13
-
14
-
15
-
16
-
17
-
18
-
19
-
20
-
21
-
22
-
23
-
24
-
25
-
26
-
27
-
28
-
29
-
30
-
31
-
32
-
33
-
34
-
35
-
36
-
37
-
38
-
39
-
40
-
41
-
42
-
43
-
44
-
45
-
46
-
47
-
 48
48 -
 49
49 -
 50
50 -
 51
51 -
 52
52 -
 53
53 -
 54
54 -
 55
55 -
 56
56 -
 57
57 -
 58
58 -
 59
59 -
 60
60 -
 61
61 -
 62
62 -
 63
63 -
 64
64 -
 65
65 -
 66
66 -
 67
67 -
 68
68 -
69
-
70
-
71
-
72
-
73
-
74
-
75
-
76
-
77
-
78
-
79
-
80
-
81
-
82
-
83
-
84
-
85
-
86
-
87
-
88
-
89
-
90
-
91
-
92
-
93
-
94
-
95
-
96
-
97
-
98
-
99
-
100
-
101
-
102
-
103
-
104
-
105
-
106
-
107
-
108
-
109
-
110
-
111
-
112
-
113
-
114
-
115
-
116
-
117
-
118
-
119
-
120
-
121
-
122
-
123
-
124
-
125
-
126
-
127
-
128
-
129
-
130
-
131
-
132
-
133
-
134
-
135
-
136
-
137
-
138
-
139
-
140
-
141
-
142
-
143
-
144
-
145
-
146
-
147
-
148
-
149
-
150
-
151
-
152
-
153
-
154
-
155
-
156
-
157
-
158
-
159
-
160
-
161
-
162
-
163
-
164
-
165
-
166
-
167
-
168
-
169
-
170
-
171
-
172
-
173
-
174
-
175
-
176
-
177
-
178
-
179
-
180
-
181
-
182
-
183
-
184
-
185
-
186
-
187
-
188
-
189
-
190
-
191
-
192
-
193
-
194
-
195
-
196
-
197
-
198
-
199
-
200
-
201
-
202
-
203
-
204
-
205
-
206
-
207
-
208
-
209
-
210
-
211
-
212
-
213
-
214
-
215
-
216
-
217
-
218
-
219
-
220
-
221
-
222
-
223
-
224
-
225
-
226
-
227
-
228
-
229
-
230
-
231
-
232
-
233
-
234
-
235
-
236
-
237
-
238
-
239
-
240
-
241
-
242
-
243
-
244
-
245
-
246
-
247
-
248
-
249
-
250
-
251
-
252
-
253
-
254
-
255
-
256
-
257
-
258
-
259
-
260
-
261
-
262
-
263
-
264
-
265
-
266
-
267
-
268
-
269
-
270
-
271
-
272
-
273
-
274
-
275
-
276
-
277
-
278
-
279
-
280
-
281
-
282
-
283
-
284
-
285
-
286
-
287
-
288
-
289
-
290
-
291
-
292
-
293
-
294
-
295
-
296
-
297
-
298
-
299
-
300
-
301
-
302
-
303
-
304
-
305
-
306
-
307
-
308
-
309
-
310
-
311
-
312
-
313
-
314
-
315
-
316
-
317
-
318
-
319
-
320
-
321
-
322
-
323
-
324
-
325
-
326
-
327
-
328
-
329
-
330
-
331
-
332
-
333
-
334
-
335
-
336
-
337
-
338
-
339
-
340
-
341
-
342
-
343
-
344
-
345
-
346
-
347
-
348
-
349
-
350
-
351
-
352
-
353
-
354
-
355
-
356
-
357
-
358
-
359
-
360
-
361
-
362
-
363
-
364
-
365
-
366
 |
 |

57
Report on
Operations
Financial Services
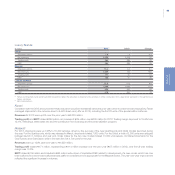
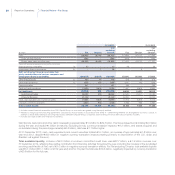
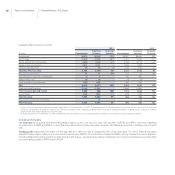
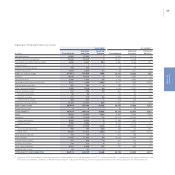
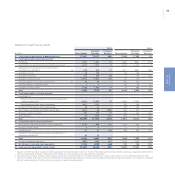
Net revenues for Financial Services totaled €370 million for the year, down 6% over 2012 (CER +4%). Trading profit totaled €16 million,
compared with €90 million for 2012.
Revenues Trading Profit
2013 2012 Change (€ million) 2013 2012 Change
323 347 -24 Mass-market Brands (LATAM, APAC, EMEA) 375 -72
47 47 - Luxury Brands (Ferrari) 13 15 -2
370 394 -24 Total 16 90 -74
Mass-market Brands (LATAM, APAC, EMEA)
The Group offers financial services to support vehicle sales in Europe, Latin America and China directly through its financial services subsidiaries
or associates. In other markets, the Group’s sales activities are supported by vendor programs offered jointly with leading partner banks.
In Europe, financial services are provided by FGA Capital, a 50/50 joint venture with the Crédit Agricole Group (accounted for under the equity
method). FGA Capital supports the Group’s sales activities through dealer financing, retail financing and medium and long-term rental. The
collaboration with Crédit Agricole has produced results that are in line with expectations and meet the Group’s commercial needs. During the
year, the two partners renewed the agreement (ahead of scheduled expiry date) for a further 8 years (2021).
New financing to the dealer network totaled €12,787 million (€13,292 million in 2012).
Retail financing (which this year also includes finance leases) was provided on 439,343 vehicles, representing a financed value of €7,163 million
and a penetration rate of 26% on Group sales (2012: 387,800 vehicles, financed value of €6,015 million and 21% penetration rate of sales for
Group brands).
There were new medium and long-term rental agreements on 54,768 vehicles, representing a financed value of €647 million and a penetration
rate of 5.2% on Group sales (2012: 53,643 rental agreements, financed value of €632 million and 4.8% penetration rate of sales for Group
brands).
In Italy, Fidis S.p.A. (a wholly-owned subsidiary of Fiat Group Automobiles S.p.A.) also manages a factoring portfolio and issues guarantees
on behalf of Fiat Group.
For Latin America and China, dealer and retail financial services are provided by Banco Fidis in Brazil, Fiat Crédito Compañía Financiera in
Argentina and Fiat Automotive Finance in China. All three companies are subsidiaries of Fidis S.p.A. and, in addition to their principal activities
in support of the FGA and Chrysler networks, they also provide financing to customers and the dealer networks of Iveco, CNH and, in China,
their joint ventures.
The average managed portfolio of Fidis and its subsidiaries was €3,157 million (€2,963 million in 2012), of which €1,473 million was dealer
financing, essentially in Brazil (€1,304 million in 2012), and €778 million end-customer financing (€945 million in 2012).
In 2013, revenues for the Financial Services companies that support the sales activities of the Mass-market Brands were down 7% in nominal
terms. On a constant currency basis, however, there was a 4% increase over 2012, primarily due to an increase in the average portfolio in Brazil
and Argentina.
Trading profit totaled €3 million. The decrease over the €75 million profit for 2012 was mainly attributable to an increase in bad debt provisions
in APAC and LATAM.