Chrysler 2013 Annual Report Download - page 203
Download and view the complete annual report
Please find page 203 of the 2013 Chrysler annual report below. You can navigate through the pages in the report by either clicking on the pages listed below, or by using the keyword search tool below to find specific information within the annual report.-
 1
1 -
2
-
3
-
4
-
5
-
6
-
7
-
8
-
9
-
10
-
11
-
12
-
13
-
14
-
15
-
16
-
17
-
18
-
19
-
20
-
21
-
22
-
23
-
24
-
25
-
26
-
27
-
28
-
29
-
30
-
31
-
32
-
33
-
34
-
35
-
36
-
37
-
38
-
39
-
40
-
41
-
42
-
43
-
44
-
45
-
46
-
47
-
48
-
49
-
50
-
51
-
52
-
53
-
54
-
55
-
56
-
57
-
58
-
59
-
60
-
61
-
62
-
63
-
64
-
65
-
66
-
67
-
68
-
69
-
70
-
71
-
72
-
73
-
74
-
75
-
76
-
77
-
78
-
79
-
80
-
81
-
82
-
83
-
84
-
85
-
86
-
87
-
88
-
89
-
90
-
91
-
92
-
93
-
94
-
95
-
96
-
97
-
98
-
99
-
100
-
101
-
102
-
103
-
104
-
105
-
106
-
107
-
108
-
109
-
110
-
111
-
112
-
113
-
114
-
115
-
116
-
117
-
118
-
119
-
120
-
121
-
122
-
123
-
124
-
125
-
126
-
127
-
128
-
129
-
130
-
131
-
132
-
133
-
134
-
135
-
136
-
137
-
138
-
139
-
140
-
141
-
142
-
143
-
144
-
145
-
146
-
147
-
148
-
149
-
150
-
151
-
152
-
153
-
154
-
155
-
156
-
157
-
158
-
159
-
160
-
161
-
162
-
163
-
164
-
165
-
166
-
167
-
168
-
169
-
170
-
171
-
172
-
173
-
174
-
175
-
176
-
177
-
178
-
179
-
180
-
181
-
182
-
183
-
184
-
185
-
186
-
187
-
188
-
189
-
190
-
191
-
192
-
 193
193 -
 194
194 -
 195
195 -
 196
196 -
 197
197 -
 198
198 -
 199
199 -
 200
200 -
 201
201 -
 202
202 -
 203
203 -
 204
204 -
 205
205 -
 206
206 -
 207
207 -
 208
208 -
 209
209 -
 210
210 -
 211
211 -
 212
212 -
 213
213 -
214
-
215
-
216
-
217
-
218
-
219
-
220
-
221
-
222
-
223
-
224
-
225
-
226
-
227
-
228
-
229
-
230
-
231
-
232
-
233
-
234
-
235
-
236
-
237
-
238
-
239
-
240
-
241
-
242
-
243
-
244
-
245
-
246
-
247
-
248
-
249
-
250
-
251
-
252
-
253
-
254
-
255
-
256
-
257
-
258
-
259
-
260
-
261
-
262
-
263
-
264
-
265
-
266
-
267
-
268
-
269
-
270
-
271
-
272
-
273
-
274
-
275
-
276
-
277
-
278
-
279
-
280
-
281
-
282
-
283
-
284
-
285
-
286
-
287
-
288
-
289
-
290
-
291
-
292
-
293
-
294
-
295
-
296
-
297
-
298
-
299
-
300
-
301
-
302
-
303
-
304
-
305
-
306
-
307
-
308
-
309
-
310
-
311
-
312
-
313
-
314
-
315
-
316
-
317
-
318
-
319
-
320
-
321
-
322
-
323
-
324
-
325
-
326
-
327
-
328
-
329
-
330
-
331
-
332
-
333
-
334
-
335
-
336
-
337
-
338
-
339
-
340
-
341
-
342
-
343
-
344
-
345
-
346
-
347
-
348
-
349
-
350
-
351
-
352
-
353
-
354
-
355
-
356
-
357
-
358
-
359
-
360
-
361
-
362
-
363
-
364
-
365
-
366
 |
 |

202 Consolidated
Financial Statements
at 31 December 2013
Notes
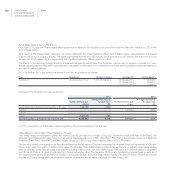
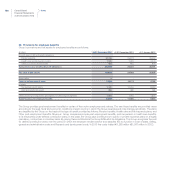
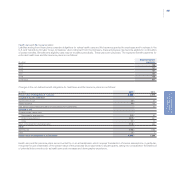
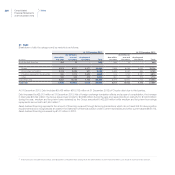
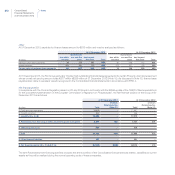
The weighted average assumptions used to determine the defined benefit obligations are as follows:
At 31 December 2013 At 31 December 2012
(In %) USA Canada USA Canada
Discount rate 4.9 4.7 4.1 3.9
Salary growth n/a 2.7 n/a 2.7
Weighted average ultimate healthcare cost trend rate 5.0 3.6 5.0 3.7
The discount rates used for the measurement of these obligations are based on yields of high-quality (AA-rated) fixed income securities for
which the timing and amounts of payments match the timing and amounts of the projected benefit payments. The average duration of the U.S.
and Canadian liabilities was approximately 12 and 15 years, respectively.
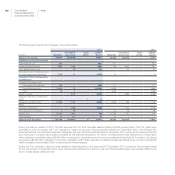
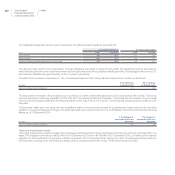
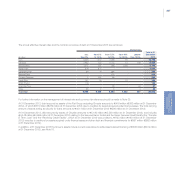
The effect of the increase or decrease of 0.1% in the assumed discount rate, holding all other assumptions constant, is as follows:
(€ million)
0.1% decrease
in discount rate
0.1% increase
in discount rate
Effect on defined benefit obligation 24 (23)
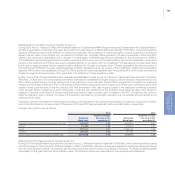
The annual rate of increase in the per capita cost of covered U.S. health care benefits assumed for 2013 was 6.8% (8.0% in 2012). The annual
rate was assumed to decrease gradually to 5.0% after 2017 and remain at that level thereafter. The annual rate of increase in the per capita
cost of covered Canadian health care benefits assumed for 2013 was 3.3% (3.7% in 2012). The annual rate was assumed to remain at 3.6%
thereafter.
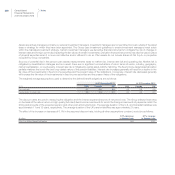
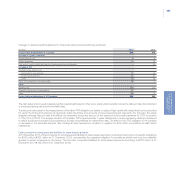
The assumed health care cost trend rate has a significant effect on the amounts reported for postretirement health care and life insurance
benefits. A one percentage point change in the assumed health care cost trend rate for U.S. and Canada combined would have the following
effects as of 31 December 2013:
(€ million)
1 % decrease in
assumed health care
trend rate
1 % increase in
assumed health care
trend rate
Effect on defined benefit obligation (40) 48
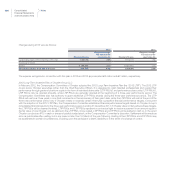
Other post-employment benefits
Other post-employment benefits includes other employee benefits granted to Group employees in Europe and comprise, amongst other, the
Italian TFR (obligation amounting to €825 million at 31 December 2013 and to €796 million at 31 December 2012), consisting of the residual
obligation for the benefit due to employees of Italian companies until 31 December 2006, having more than 50 employees and accrued over
the employee’s working life for the others and settled when an employee leaves the Group. These schemes are unfunded.