Chrysler 2013 Annual Report Download - page 184
Download and view the complete annual report
Please find page 184 of the 2013 Chrysler annual report below. You can navigate through the pages in the report by either clicking on the pages listed below, or by using the keyword search tool below to find specific information within the annual report.-
 1
1 -
2
-
3
-
4
-
5
-
6
-
7
-
8
-
9
-
10
-
11
-
12
-
13
-
14
-
15
-
16
-
17
-
18
-
19
-
20
-
21
-
22
-
23
-
24
-
25
-
26
-
27
-
28
-
29
-
30
-
31
-
32
-
33
-
34
-
35
-
36
-
37
-
38
-
39
-
40
-
41
-
42
-
43
-
44
-
45
-
46
-
47
-
48
-
49
-
50
-
51
-
52
-
53
-
54
-
55
-
56
-
57
-
58
-
59
-
60
-
61
-
62
-
63
-
64
-
65
-
66
-
67
-
68
-
69
-
70
-
71
-
72
-
73
-
74
-
75
-
76
-
77
-
78
-
79
-
80
-
81
-
82
-
83
-
84
-
85
-
86
-
87
-
88
-
89
-
90
-
91
-
92
-
93
-
94
-
95
-
96
-
97
-
98
-
99
-
100
-
101
-
102
-
103
-
104
-
105
-
106
-
107
-
108
-
109
-
110
-
111
-
112
-
113
-
114
-
115
-
116
-
117
-
118
-
119
-
120
-
121
-
122
-
123
-
124
-
125
-
126
-
127
-
128
-
129
-
130
-
131
-
132
-
133
-
134
-
135
-
136
-
137
-
138
-
139
-
140
-
141
-
142
-
143
-
144
-
145
-
146
-
147
-
148
-
149
-
150
-
151
-
152
-
153
-
154
-
155
-
156
-
157
-
158
-
159
-
160
-
161
-
162
-
163
-
164
-
165
-
166
-
167
-
168
-
169
-
170
-
171
-
172
-
173
-
 174
174 -
 175
175 -
 176
176 -
 177
177 -
 178
178 -
 179
179 -
 180
180 -
 181
181 -
 182
182 -
 183
183 -
 184
184 -
 185
185 -
 186
186 -
 187
187 -
 188
188 -
 189
189 -
 190
190 -
 191
191 -
 192
192 -
 193
193 -
 194
194 -
195
-
196
-
197
-
198
-
199
-
200
-
201
-
202
-
203
-
204
-
205
-
206
-
207
-
208
-
209
-
210
-
211
-
212
-
213
-
214
-
215
-
216
-
217
-
218
-
219
-
220
-
221
-
222
-
223
-
224
-
225
-
226
-
227
-
228
-
229
-
230
-
231
-
232
-
233
-
234
-
235
-
236
-
237
-
238
-
239
-
240
-
241
-
242
-
243
-
244
-
245
-
246
-
247
-
248
-
249
-
250
-
251
-
252
-
253
-
254
-
255
-
256
-
257
-
258
-
259
-
260
-
261
-
262
-
263
-
264
-
265
-
266
-
267
-
268
-
269
-
270
-
271
-
272
-
273
-
274
-
275
-
276
-
277
-
278
-
279
-
280
-
281
-
282
-
283
-
284
-
285
-
286
-
287
-
288
-
289
-
290
-
291
-
292
-
293
-
294
-
295
-
296
-
297
-
298
-
299
-
300
-
301
-
302
-
303
-
304
-
305
-
306
-
307
-
308
-
309
-
310
-
311
-
312
-
313
-
314
-
315
-
316
-
317
-
318
-
319
-
320
-
321
-
322
-
323
-
324
-
325
-
326
-
327
-
328
-
329
-
330
-
331
-
332
-
333
-
334
-
335
-
336
-
337
-
338
-
339
-
340
-
341
-
342
-
343
-
344
-
345
-
346
-
347
-
348
-
349
-
350
-
351
-
352
-
353
-
354
-
355
-
356
-
357
-
358
-
359
-
360
-
361
-
362
-
363
-
364
-
365
-
366
 |
 |

183
Consolidated
Financial Statements
at 31 December 2013
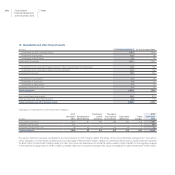
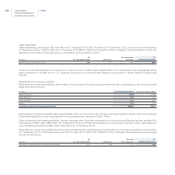
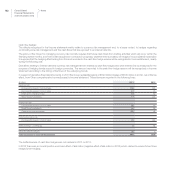
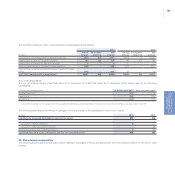
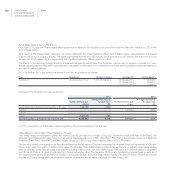
Fair value hedges
The gains and losses arising from the valuation of outstanding interest rate and currency derivatives financial instruments (mostly for managing
currency risk) and interest rate derivatives (for managing the interest rate risk) recognized in accordance with fair value hedge accounting and
the gains and losses arising from the respective hedged items are set out in the following table:
(€ million) 2013 2012
Currency risk
Net gains/(losses) on qualifying hedges 19 14
Fair value changes in hedged items (19) (14)
Interest rate risk
Net gains/(losses) on qualifying hedges (28) (51)
Fair value changes in hedged items 29 53
Net gains/(losses) 12
The ineffective portion of transactions treated as fair value hedges was a positive amount of €1 million in 2013 (positive amount of €2 million
in 2012).
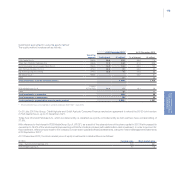
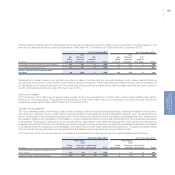
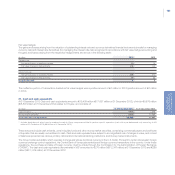
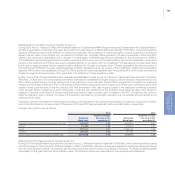
21. Cash and cash equivalents
At 31 December 2013 Cash and cash equivalents amount to €19,439 million (€17,657 million at 31 December 2012), of which €9,676 million
(€8,803 million at 31 December 2012) relates to Chrysler, and consists of:
(€ million) At 31 December 2013 At 31 December 2012
Cash at banks(*) 9,923 7,568
Money market securities 9,516 10,089
Total Cash and cash equivalents 19,439 17,657
(*) Includes bank deposits which may be used exclusively by Group companies entitled to perform specific operations (cash with a pre-determined use) amounting to €3
million at 31 December 2013 (€8 million at 31 December 2012).
These amounts include cash at banks, units in liquidity funds and other money market securities, comprising commercial papers and certificate
of deposits, that are readily convertible into cash. Cash and cash equivalents are subject to an insignificant risk of changes in value, and consist
of balances spread across various primary national and international banking institutions, and money market instruments.
The Group holds a subsidiary which operates in Venezuela whose functional currency is the U.S. Dollar. Pursuant to certain Venezuelan foreign
currency exchange control regulations, the Central Bank of Venezuela centralizes all foreign currency transactions in the country. Under these
regulations, the purchase and sale of foreign currency must be made through the Commission for the Administration of Foreign Exchange
(“CADIVI”). The cash and cash equivalents denominated in VEF amounted to €270 million (VEF 2,347 million) at 31 December 2013 and €260
million (VEF 1,476 million) at 31 December 2012.