Chrysler 2013 Annual Report Download - page 159
Download and view the complete annual report
Please find page 159 of the 2013 Chrysler annual report below. You can navigate through the pages in the report by either clicking on the pages listed below, or by using the keyword search tool below to find specific information within the annual report.-
 1
1 -
2
-
3
-
4
-
5
-
6
-
7
-
8
-
9
-
10
-
11
-
12
-
13
-
14
-
15
-
16
-
17
-
18
-
19
-
20
-
21
-
22
-
23
-
24
-
25
-
26
-
27
-
28
-
29
-
30
-
31
-
32
-
33
-
34
-
35
-
36
-
37
-
38
-
39
-
40
-
41
-
42
-
43
-
44
-
45
-
46
-
47
-
48
-
49
-
50
-
51
-
52
-
53
-
54
-
55
-
56
-
57
-
58
-
59
-
60
-
61
-
62
-
63
-
64
-
65
-
66
-
67
-
68
-
69
-
70
-
71
-
72
-
73
-
74
-
75
-
76
-
77
-
78
-
79
-
80
-
81
-
82
-
83
-
84
-
85
-
86
-
87
-
88
-
89
-
90
-
91
-
92
-
93
-
94
-
95
-
96
-
97
-
98
-
99
-
100
-
101
-
102
-
103
-
104
-
105
-
106
-
107
-
108
-
109
-
110
-
111
-
112
-
113
-
114
-
115
-
116
-
117
-
118
-
119
-
120
-
121
-
122
-
123
-
124
-
125
-
126
-
127
-
128
-
129
-
130
-
131
-
132
-
133
-
134
-
135
-
136
-
137
-
138
-
139
-
140
-
141
-
142
-
143
-
144
-
145
-
146
-
147
-
148
-
 149
149 -
 150
150 -
 151
151 -
 152
152 -
 153
153 -
 154
154 -
 155
155 -
 156
156 -
 157
157 -
 158
158 -
 159
159 -
 160
160 -
 161
161 -
 162
162 -
 163
163 -
 164
164 -
 165
165 -
 166
166 -
 167
167 -
 168
168 -
 169
169 -
170
-
171
-
172
-
173
-
174
-
175
-
176
-
177
-
178
-
179
-
180
-
181
-
182
-
183
-
184
-
185
-
186
-
187
-
188
-
189
-
190
-
191
-
192
-
193
-
194
-
195
-
196
-
197
-
198
-
199
-
200
-
201
-
202
-
203
-
204
-
205
-
206
-
207
-
208
-
209
-
210
-
211
-
212
-
213
-
214
-
215
-
216
-
217
-
218
-
219
-
220
-
221
-
222
-
223
-
224
-
225
-
226
-
227
-
228
-
229
-
230
-
231
-
232
-
233
-
234
-
235
-
236
-
237
-
238
-
239
-
240
-
241
-
242
-
243
-
244
-
245
-
246
-
247
-
248
-
249
-
250
-
251
-
252
-
253
-
254
-
255
-
256
-
257
-
258
-
259
-
260
-
261
-
262
-
263
-
264
-
265
-
266
-
267
-
268
-
269
-
270
-
271
-
272
-
273
-
274
-
275
-
276
-
277
-
278
-
279
-
280
-
281
-
282
-
283
-
284
-
285
-
286
-
287
-
288
-
289
-
290
-
291
-
292
-
293
-
294
-
295
-
296
-
297
-
298
-
299
-
300
-
301
-
302
-
303
-
304
-
305
-
306
-
307
-
308
-
309
-
310
-
311
-
312
-
313
-
314
-
315
-
316
-
317
-
318
-
319
-
320
-
321
-
322
-
323
-
324
-
325
-
326
-
327
-
328
-
329
-
330
-
331
-
332
-
333
-
334
-
335
-
336
-
337
-
338
-
339
-
340
-
341
-
342
-
343
-
344
-
345
-
346
-
347
-
348
-
349
-
350
-
351
-
352
-
353
-
354
-
355
-
356
-
357
-
358
-
359
-
360
-
361
-
362
-
363
-
364
-
365
-
366
 |
 |

158 Consolidated
Financial Statements
at 31 December 2013
Notes
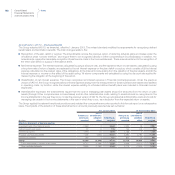
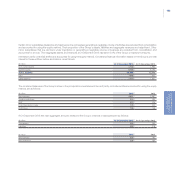
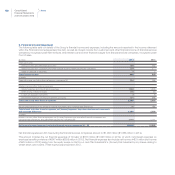
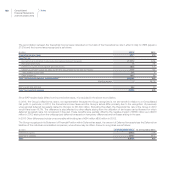
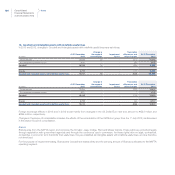
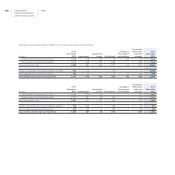
9. Financial income/(expenses)
The following table sets out details of the Group’s financial income and expenses, including the amounts reported in the Income statement
within the Financial income/(expenses) line item, as well as interest income from customers and other financial income of financial services
companies, recognized under Net revenues, and Interest cost and other financial charges from financial services companies, recognized under
Cost of sales.
(€ million) 2013 2012
Financial income:
Interest income and other financial income 200 254
Interest income from customers and other financial income of financial services companies 239 277
Gains on disposal of securities 42
Total Financial income 443 533
of which:
Financial income, excluding financial services companies (A) 204 256
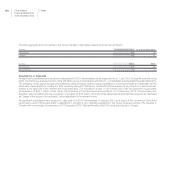
Interest cost and other financial expenses:
Interest expense and other financial expenses 1,880 1,936
Write-downs of financial assets 105 50
Losses on disposal of securities 39
Net interest expenses on employee benefits provisions 371 388
Total Interest and other financial expenses 2,359 2,383
Net (income)/expenses from derivative financial instruments and exchange rate differences (1) (84)
Total interest and other financial expenses, net (income)/expenses from derivative financial instruments
and exchange differences 2,358 2,299
of which:
Interest cost and other financial expenses, net (income)/expenses from derivative financial instruments and
exchange rate differences, excluding financial services companies (B) 2,168 2,141
Net financial income/(expenses) excluding financial services companies (A) – (B) (1,964) (1,885)
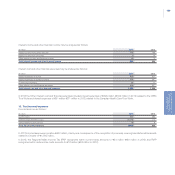
Net financial expenses in 2013 (excluding the financial services companies) amount to €1,964 million (€1,885 million in 2012).
This amount includes the net financial expenses of Chrysler of €975 million (€1,068 million in 2012), of which net interest expenses on
employee benefits provisions of €347 million (€356 million in 2012). Net financial expenses also include net income of €31 million (net income
of €34 million in 2012) arising from the equity swaps on Fiat S.p.A. and CNH Industrial N.V. (formerly Fiat Industrial S.p.A.) shares relating to
certain stock option plans. These equity swaps expired in 2013.