Chrysler 2013 Annual Report Download - page 149
Download and view the complete annual report
Please find page 149 of the 2013 Chrysler annual report below. You can navigate through the pages in the report by either clicking on the pages listed below, or by using the keyword search tool below to find specific information within the annual report.-
 1
1 -
2
-
3
-
4
-
5
-
6
-
7
-
8
-
9
-
10
-
11
-
12
-
13
-
14
-
15
-
16
-
17
-
18
-
19
-
20
-
21
-
22
-
23
-
24
-
25
-
26
-
27
-
28
-
29
-
30
-
31
-
32
-
33
-
34
-
35
-
36
-
37
-
38
-
39
-
40
-
41
-
42
-
43
-
44
-
45
-
46
-
47
-
48
-
49
-
50
-
51
-
52
-
53
-
54
-
55
-
56
-
57
-
58
-
59
-
60
-
61
-
62
-
63
-
64
-
65
-
66
-
67
-
68
-
69
-
70
-
71
-
72
-
73
-
74
-
75
-
76
-
77
-
78
-
79
-
80
-
81
-
82
-
83
-
84
-
85
-
86
-
87
-
88
-
89
-
90
-
91
-
92
-
93
-
94
-
95
-
96
-
97
-
98
-
99
-
100
-
101
-
102
-
103
-
104
-
105
-
106
-
107
-
108
-
109
-
110
-
111
-
112
-
113
-
114
-
115
-
116
-
117
-
118
-
119
-
120
-
121
-
122
-
123
-
124
-
125
-
126
-
127
-
128
-
129
-
130
-
131
-
132
-
133
-
134
-
135
-
136
-
137
-
138
-
 139
139 -
 140
140 -
 141
141 -
 142
142 -
 143
143 -
 144
144 -
 145
145 -
 146
146 -
 147
147 -
 148
148 -
 149
149 -
 150
150 -
 151
151 -
 152
152 -
 153
153 -
 154
154 -
 155
155 -
 156
156 -
 157
157 -
 158
158 -
 159
159 -
160
-
161
-
162
-
163
-
164
-
165
-
166
-
167
-
168
-
169
-
170
-
171
-
172
-
173
-
174
-
175
-
176
-
177
-
178
-
179
-
180
-
181
-
182
-
183
-
184
-
185
-
186
-
187
-
188
-
189
-
190
-
191
-
192
-
193
-
194
-
195
-
196
-
197
-
198
-
199
-
200
-
201
-
202
-
203
-
204
-
205
-
206
-
207
-
208
-
209
-
210
-
211
-
212
-
213
-
214
-
215
-
216
-
217
-
218
-
219
-
220
-
221
-
222
-
223
-
224
-
225
-
226
-
227
-
228
-
229
-
230
-
231
-
232
-
233
-
234
-
235
-
236
-
237
-
238
-
239
-
240
-
241
-
242
-
243
-
244
-
245
-
246
-
247
-
248
-
249
-
250
-
251
-
252
-
253
-
254
-
255
-
256
-
257
-
258
-
259
-
260
-
261
-
262
-
263
-
264
-
265
-
266
-
267
-
268
-
269
-
270
-
271
-
272
-
273
-
274
-
275
-
276
-
277
-
278
-
279
-
280
-
281
-
282
-
283
-
284
-
285
-
286
-
287
-
288
-
289
-
290
-
291
-
292
-
293
-
294
-
295
-
296
-
297
-
298
-
299
-
300
-
301
-
302
-
303
-
304
-
305
-
306
-
307
-
308
-
309
-
310
-
311
-
312
-
313
-
314
-
315
-
316
-
317
-
318
-
319
-
320
-
321
-
322
-
323
-
324
-
325
-
326
-
327
-
328
-
329
-
330
-
331
-
332
-
333
-
334
-
335
-
336
-
337
-
338
-
339
-
340
-
341
-
342
-
343
-
344
-
345
-
346
-
347
-
348
-
349
-
350
-
351
-
352
-
353
-
354
-
355
-
356
-
357
-
358
-
359
-
360
-
361
-
362
-
363
-
364
-
365
-
366
 |
 |

148 Consolidated
Financial Statements
at 31 December 2013
Notes
Amendments to IAS 19 – Employee Benefits
The Group adopted IAS 19, as amended, effective 1 January 2013. The revised standard modifies the requirements for recognizing defined
benefit plans and termination benefits. The main changes relate to the:
Recognition of the plan deficit or surplus: The amendments remove the previous option of deferring actuarial gains and losses under the
off balance sheet “corridor method”, and require them to be recognized directly in Other comprehensive income/(losses). In addition, the
amendments require the immediate recognition of past service costs in the Income statement. These amendments led to the recognition of
the entire plan deficit or surplus in the balance sheet.
Net interest expense: The interest expense, calculated by using a discount rate, and the expected return on plan assets, calculated by using
a long-term rate of return of assets, are replaced by the net interest expense on the plan deficit or surplus, which consists of (i) the interest
expense calculated on the present value of the obligations, (ii) the interest income arising from the valuation of the plan assets, and (iii) the
interest expense or income on the effect of the asset ceiling. All above components are calculated by using the discount rate applied for
measuring the obligation at the beginning of the period.
Classification of net interest expense: The Group recognizes net interest expense in Financial income/(expenses). Under the previous
version of IAS 19, the Group recognized all income and expense arising from the measurement of funded pension plan assets and liabilities
in operating costs, by function, while the interest expense relating to unfunded defined benefit plans was included in Financial income/
(expenses).
Administrative expenses: the amendments require that the cost of managing plan assets should be deducted from the return on plan
assets (through Other comprehensive income/losses) and all other administrative costs relating to assets should be recognized in the
Income statements in the year they occur. Under the previous version of IAS 19, the Group recognized all administrative costs and costs for
managing plan assets in the Income statements in the year in which they occur, as a deduction from the expected return on assets.
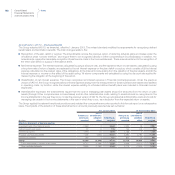
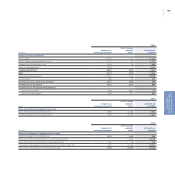
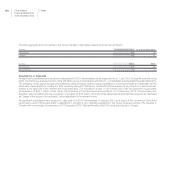
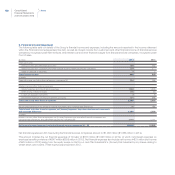
The Group applied the relevant transitional provisions and restated the comparative amounts reported in this Annual report on a retrospective
basis. The impacts of the adoption of these amendments on amounts previously reported are set out below:
At 1 January 2012 At 31 December 2012
(€ million)
Amounts as
previously
reported
IAS 19
amendments
adoption
effect
Amounts as
restated
Amounts as
previously
reported
IAS 19
amendments
adoption
effect
Amounts as
restated
Effects on Statement of financial position
Investments and other financial assets 2,660 3 2,663 2,290 (3) 2,287
Defined benefit plan assets 97 8 105 105 (12) 93
Deferred tax assets 1,690 (1) 1,689 1,736 2 1,738
Provision for employee benefits 7,026 2,558 9,584 6,694 4,792 11,486
Deferred tax liabilities 760 1 761 802 (1) 801
Equity: 12,260 (2,549) 9,711 13,173 (4,804) 8,369
Equity attributable to owners of the parent 8,727 (1,369) 7,358 9,059 (2,872) 6,187
Non-controlling interests 3,533 (1,180) 2,353 4,114 (1,932) 2,182