Chrysler 2013 Annual Report Download - page 222
Download and view the complete annual report
Please find page 222 of the 2013 Chrysler annual report below. You can navigate through the pages in the report by either clicking on the pages listed below, or by using the keyword search tool below to find specific information within the annual report.-
 1
1 -
2
-
3
-
4
-
5
-
6
-
7
-
8
-
9
-
10
-
11
-
12
-
13
-
14
-
15
-
16
-
17
-
18
-
19
-
20
-
21
-
22
-
23
-
24
-
25
-
26
-
27
-
28
-
29
-
30
-
31
-
32
-
33
-
34
-
35
-
36
-
37
-
38
-
39
-
40
-
41
-
42
-
43
-
44
-
45
-
46
-
47
-
48
-
49
-
50
-
51
-
52
-
53
-
54
-
55
-
56
-
57
-
58
-
59
-
60
-
61
-
62
-
63
-
64
-
65
-
66
-
67
-
68
-
69
-
70
-
71
-
72
-
73
-
74
-
75
-
76
-
77
-
78
-
79
-
80
-
81
-
82
-
83
-
84
-
85
-
86
-
87
-
88
-
89
-
90
-
91
-
92
-
93
-
94
-
95
-
96
-
97
-
98
-
99
-
100
-
101
-
102
-
103
-
104
-
105
-
106
-
107
-
108
-
109
-
110
-
111
-
112
-
113
-
114
-
115
-
116
-
117
-
118
-
119
-
120
-
121
-
122
-
123
-
124
-
125
-
126
-
127
-
128
-
129
-
130
-
131
-
132
-
133
-
134
-
135
-
136
-
137
-
138
-
139
-
140
-
141
-
142
-
143
-
144
-
145
-
146
-
147
-
148
-
149
-
150
-
151
-
152
-
153
-
154
-
155
-
156
-
157
-
158
-
159
-
160
-
161
-
162
-
163
-
164
-
165
-
166
-
167
-
168
-
169
-
170
-
171
-
172
-
173
-
174
-
175
-
176
-
177
-
178
-
179
-
180
-
181
-
182
-
183
-
184
-
185
-
186
-
187
-
188
-
189
-
190
-
191
-
192
-
193
-
194
-
195
-
196
-
197
-
198
-
199
-
200
-
201
-
202
-
203
-
204
-
205
-
206
-
207
-
208
-
209
-
210
-
211
-
 212
212 -
 213
213 -
 214
214 -
 215
215 -
 216
216 -
 217
217 -
 218
218 -
 219
219 -
 220
220 -
 221
221 -
 222
222 -
 223
223 -
 224
224 -
 225
225 -
 226
226 -
 227
227 -
 228
228 -
 229
229 -
 230
230 -
 231
231 -
 232
232 -
233
-
234
-
235
-
236
-
237
-
238
-
239
-
240
-
241
-
242
-
243
-
244
-
245
-
246
-
247
-
248
-
249
-
250
-
251
-
252
-
253
-
254
-
255
-
256
-
257
-
258
-
259
-
260
-
261
-
262
-
263
-
264
-
265
-
266
-
267
-
268
-
269
-
270
-
271
-
272
-
273
-
274
-
275
-
276
-
277
-
278
-
279
-
280
-
281
-
282
-
283
-
284
-
285
-
286
-
287
-
288
-
289
-
290
-
291
-
292
-
293
-
294
-
295
-
296
-
297
-
298
-
299
-
300
-
301
-
302
-
303
-
304
-
305
-
306
-
307
-
308
-
309
-
310
-
311
-
312
-
313
-
314
-
315
-
316
-
317
-
318
-
319
-
320
-
321
-
322
-
323
-
324
-
325
-
326
-
327
-
328
-
329
-
330
-
331
-
332
-
333
-
334
-
335
-
336
-
337
-
338
-
339
-
340
-
341
-
342
-
343
-
344
-
345
-
346
-
347
-
348
-
349
-
350
-
351
-
352
-
353
-
354
-
355
-
356
-
357
-
358
-
359
-
360
-
361
-
362
-
363
-
364
-
365
-
366
 |
 |

221
Consolidated
Financial Statements
at 31 December 2013
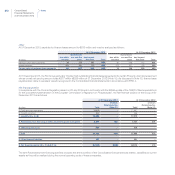
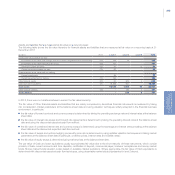
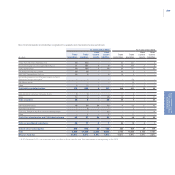
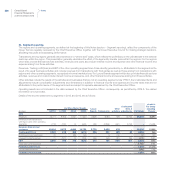
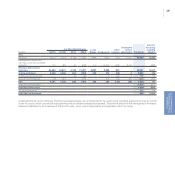
Emoluments to Directors, Statutory Auditors and Key Management
The fees of the Director and Statutory Auditors of Fiat S.p.A. for carrying out their respective functions, including those in other consolidated
companies, are as follows:
(in € thousands) 2013 2012
Directors (a) 18,912 22,780
Statutory auditors 230 229
Total Emoluments 19,142 23,009
(a) This amount includes the notional compensation cost arising from stock grants granted to the Chief Executive Officer.
The aggregate compensation payable to executives with strategic responsibilities was approximately €30 million for 2013. This is inclusive of
an amount of €3 million as the Fiat Group’s contribution to State and employer defined contribution pension funds.
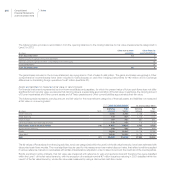
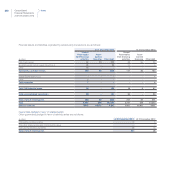
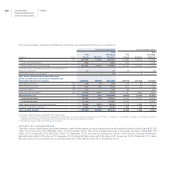
32. Explanatory notes to the Statement of cash flows
The Statement of cash flows sets out changes in Cash and cash equivalents during the year. As required by IAS 7 – Statement of cash
flows, cash flows are separated into operating, investing and financing activities. The effects of changes in exchange rates on cash and cash
equivalents are shown separately under the line item Translation exchange differences.
Cash flows from (used in) operating activities mostly derive from the Group’s industrial activities.
The cash flows generated by the sale of vehicles under buy-back commitments, net of the amounts included in Profit/(loss) for the year, are
included under operating activities in a single line item which includes changes in working capital arising from these transactions.
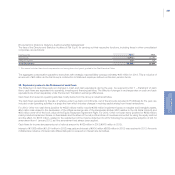
For 2013, Other non-cash items (positive for €522 million) mainly include €336 million impairment losses on tangible and intangible assets,
€54 million loss related to the devaluation of the official exchange rate of the Venezuelan Bolivar (VEF) relative to the US Dollar (Note 8) and
€56 million write-off of the book value of the Equity Recapture Agreement Right. For 2012, Other non-cash items (positive for €562 million)
mainly included impairment losses on fixed assets and the share of the net profit and loss of investees accounted for using the equity method
and the effect, for €515 million, related to the restatement of the Income statement for 2012 following the retrospective adoption of IAS 19
amendment from 1 January 2013, as if the amendment had always been applied.
Cash flows for income tax payments net of refunds amount to €429 million in 2013 (€475 million in 2012).
Interest of €1,808 million (€1,914 million in 2012) was paid and interest of €400 million (€635 million in 2012) was received in 2013. Amounts
indicated are inclusive of interest rate differentials paid or received on interest rate derivatives.