Chrysler 2013 Annual Report Download - page 234
Download and view the complete annual report
Please find page 234 of the 2013 Chrysler annual report below. You can navigate through the pages in the report by either clicking on the pages listed below, or by using the keyword search tool below to find specific information within the annual report.-
 1
1 -
2
-
3
-
4
-
5
-
6
-
7
-
8
-
9
-
10
-
11
-
12
-
13
-
14
-
15
-
16
-
17
-
18
-
19
-
20
-
21
-
22
-
23
-
24
-
25
-
26
-
27
-
28
-
29
-
30
-
31
-
32
-
33
-
34
-
35
-
36
-
37
-
38
-
39
-
40
-
41
-
42
-
43
-
44
-
45
-
46
-
47
-
48
-
49
-
50
-
51
-
52
-
53
-
54
-
55
-
56
-
57
-
58
-
59
-
60
-
61
-
62
-
63
-
64
-
65
-
66
-
67
-
68
-
69
-
70
-
71
-
72
-
73
-
74
-
75
-
76
-
77
-
78
-
79
-
80
-
81
-
82
-
83
-
84
-
85
-
86
-
87
-
88
-
89
-
90
-
91
-
92
-
93
-
94
-
95
-
96
-
97
-
98
-
99
-
100
-
101
-
102
-
103
-
104
-
105
-
106
-
107
-
108
-
109
-
110
-
111
-
112
-
113
-
114
-
115
-
116
-
117
-
118
-
119
-
120
-
121
-
122
-
123
-
124
-
125
-
126
-
127
-
128
-
129
-
130
-
131
-
132
-
133
-
134
-
135
-
136
-
137
-
138
-
139
-
140
-
141
-
142
-
143
-
144
-
145
-
146
-
147
-
148
-
149
-
150
-
151
-
152
-
153
-
154
-
155
-
156
-
157
-
158
-
159
-
160
-
161
-
162
-
163
-
164
-
165
-
166
-
167
-
168
-
169
-
170
-
171
-
172
-
173
-
174
-
175
-
176
-
177
-
178
-
179
-
180
-
181
-
182
-
183
-
184
-
185
-
186
-
187
-
188
-
189
-
190
-
191
-
192
-
193
-
194
-
195
-
196
-
197
-
198
-
199
-
200
-
201
-
202
-
203
-
204
-
205
-
206
-
207
-
208
-
209
-
210
-
211
-
212
-
213
-
214
-
215
-
216
-
217
-
218
-
219
-
220
-
221
-
222
-
223
-
 224
224 -
 225
225 -
 226
226 -
 227
227 -
 228
228 -
 229
229 -
 230
230 -
 231
231 -
 232
232 -
 233
233 -
 234
234 -
 235
235 -
 236
236 -
 237
237 -
 238
238 -
 239
239 -
 240
240 -
 241
241 -
 242
242 -
 243
243 -
 244
244 -
245
-
246
-
247
-
248
-
249
-
250
-
251
-
252
-
253
-
254
-
255
-
256
-
257
-
258
-
259
-
260
-
261
-
262
-
263
-
264
-
265
-
266
-
267
-
268
-
269
-
270
-
271
-
272
-
273
-
274
-
275
-
276
-
277
-
278
-
279
-
280
-
281
-
282
-
283
-
284
-
285
-
286
-
287
-
288
-
289
-
290
-
291
-
292
-
293
-
294
-
295
-
296
-
297
-
298
-
299
-
300
-
301
-
302
-
303
-
304
-
305
-
306
-
307
-
308
-
309
-
310
-
311
-
312
-
313
-
314
-
315
-
316
-
317
-
318
-
319
-
320
-
321
-
322
-
323
-
324
-
325
-
326
-
327
-
328
-
329
-
330
-
331
-
332
-
333
-
334
-
335
-
336
-
337
-
338
-
339
-
340
-
341
-
342
-
343
-
344
-
345
-
346
-
347
-
348
-
349
-
350
-
351
-
352
-
353
-
354
-
355
-
356
-
357
-
358
-
359
-
360
-
361
-
362
-
363
-
364
-
365
-
366
 |
 |

233
Consolidated
Financial Statements
at 31 December 2013
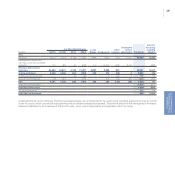
Certain of the Group’s subsidiaries are located in countries which are outside of the Eurozone, in particular the United States, Brazil, Canada,
Poland, Serbia, Turkey, Mexico, Argentina, the Czech Republic, India, China and South Africa. As the Group’s reference currency is the
Euro, the Income statements of those entities are converted into Euros using the average exchange rate for the period, and while revenues
and margins are unchanged in local currency, changes in exchange rates may lead to effects on the converted balances of revenues, costs
and the result in Euro.
The assets and liabilities of consolidated companies whose money of account is different from the Euro may acquire converted values
in Euros which differ as a function of the fluctuation in exchange rates. The effects of these changes are recognized directly in the item
Cumulative Translation Adjustments reserve, included in Other comprehensive income/(losses) (see Note 23).
The Group monitors its principal exposure to conversion exchange risk, although there was no specific hedging in this respect at the balance
sheet date.
There have been no substantial changes in 2013 in the nature or structure of exposure to currency risk or in the Group’s hedging policies.
The potential loss in fair value of derivative financial instruments held for currency risk management (currency swaps/forwards, currency
options, interest rate and currency swaps) at 31 December 2013 resulting from a hypothetical, unfavorable and instantaneous change of
10% in the exchange rates of the leading foreign currencies with the Euro would have been approximately €745 million (€690 million at 31
December 2012).
Receivables, payables and future trade flows whose hedging transactions have been analyzed were not considered in this analysis. It is
reasonable to assume that changes in exchange rates will produce the opposite effect, of an equal or greater amount, on the underlying
transactions that have been hedged.
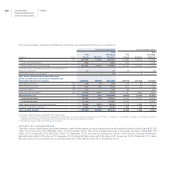
Quantitative information on interest rate risk
The manufacturing companies and treasuries of the Group make use of external funds obtained in the form of financing and invest in monetary
and financial market instruments. In addition, Group companies make sales of receivables resulting from their trading activities on a continuing
basis. Changes in market interest rates can affect the cost of the various forms of financing, including the sale of receivables, or the return on
investments, and the employment of funds, causing an impact on the level of net financial expenses incurred by the Group.
In addition, the financial services companies provide loans (mainly to customers and dealers), financing themselves using various forms of
direct debt or asset-backed financing (e.g. factoring of receivables). Where the characteristics of the variability of the interest rate applied to
loans granted differ from those of the variability of the cost of the financing obtained, changes in the current level of interest rates can affect the
Operating result of those companies and the Group as a whole.
In order to manage these risks, the Group uses interest rate derivative financial instruments, mainly interest rate swaps and forward rate
agreements, when available in the market, with the object of mitigating, under economically acceptable conditions, the potential variability of
interest rates on net profit/(loss).
In assessing the potential impact of changes in interest rates, the Group separates out fixed rate financial instruments (for which the impact is
assessed in terms of fair value) from floating rate financial instruments (for which the impact is assessed in terms of cash flows).
The fixed rate financial instruments used by the Group consist principally of part of the portfolio of the financial services companies (basically
customer financing and financial leases) and part of debt (including subsidized loans and bonds).
The potential loss in fair value of fixed rate financial instruments (including the effect of interest rate derivative financial instruments) held at
31 December 2013, resulting from a hypothetical, unfavorable and instantaneous change of 10% in market interest rates, would have been
approximately €110 million (approximately €100 million at 31 December 2012).