Chrysler 2013 Annual Report Download - page 157
Download and view the complete annual report
Please find page 157 of the 2013 Chrysler annual report below. You can navigate through the pages in the report by either clicking on the pages listed below, or by using the keyword search tool below to find specific information within the annual report.-
 1
1 -
2
-
3
-
4
-
5
-
6
-
7
-
8
-
9
-
10
-
11
-
12
-
13
-
14
-
15
-
16
-
17
-
18
-
19
-
20
-
21
-
22
-
23
-
24
-
25
-
26
-
27
-
28
-
29
-
30
-
31
-
32
-
33
-
34
-
35
-
36
-
37
-
38
-
39
-
40
-
41
-
42
-
43
-
44
-
45
-
46
-
47
-
48
-
49
-
50
-
51
-
52
-
53
-
54
-
55
-
56
-
57
-
58
-
59
-
60
-
61
-
62
-
63
-
64
-
65
-
66
-
67
-
68
-
69
-
70
-
71
-
72
-
73
-
74
-
75
-
76
-
77
-
78
-
79
-
80
-
81
-
82
-
83
-
84
-
85
-
86
-
87
-
88
-
89
-
90
-
91
-
92
-
93
-
94
-
95
-
96
-
97
-
98
-
99
-
100
-
101
-
102
-
103
-
104
-
105
-
106
-
107
-
108
-
109
-
110
-
111
-
112
-
113
-
114
-
115
-
116
-
117
-
118
-
119
-
120
-
121
-
122
-
123
-
124
-
125
-
126
-
127
-
128
-
129
-
130
-
131
-
132
-
133
-
134
-
135
-
136
-
137
-
138
-
139
-
140
-
141
-
142
-
143
-
144
-
145
-
146
-
 147
147 -
 148
148 -
 149
149 -
 150
150 -
 151
151 -
 152
152 -
 153
153 -
 154
154 -
 155
155 -
 156
156 -
 157
157 -
 158
158 -
 159
159 -
 160
160 -
 161
161 -
 162
162 -
 163
163 -
 164
164 -
 165
165 -
 166
166 -
 167
167 -
168
-
169
-
170
-
171
-
172
-
173
-
174
-
175
-
176
-
177
-
178
-
179
-
180
-
181
-
182
-
183
-
184
-
185
-
186
-
187
-
188
-
189
-
190
-
191
-
192
-
193
-
194
-
195
-
196
-
197
-
198
-
199
-
200
-
201
-
202
-
203
-
204
-
205
-
206
-
207
-
208
-
209
-
210
-
211
-
212
-
213
-
214
-
215
-
216
-
217
-
218
-
219
-
220
-
221
-
222
-
223
-
224
-
225
-
226
-
227
-
228
-
229
-
230
-
231
-
232
-
233
-
234
-
235
-
236
-
237
-
238
-
239
-
240
-
241
-
242
-
243
-
244
-
245
-
246
-
247
-
248
-
249
-
250
-
251
-
252
-
253
-
254
-
255
-
256
-
257
-
258
-
259
-
260
-
261
-
262
-
263
-
264
-
265
-
266
-
267
-
268
-
269
-
270
-
271
-
272
-
273
-
274
-
275
-
276
-
277
-
278
-
279
-
280
-
281
-
282
-
283
-
284
-
285
-
286
-
287
-
288
-
289
-
290
-
291
-
292
-
293
-
294
-
295
-
296
-
297
-
298
-
299
-
300
-
301
-
302
-
303
-
304
-
305
-
306
-
307
-
308
-
309
-
310
-
311
-
312
-
313
-
314
-
315
-
316
-
317
-
318
-
319
-
320
-
321
-
322
-
323
-
324
-
325
-
326
-
327
-
328
-
329
-
330
-
331
-
332
-
333
-
334
-
335
-
336
-
337
-
338
-
339
-
340
-
341
-
342
-
343
-
344
-
345
-
346
-
347
-
348
-
349
-
350
-
351
-
352
-
353
-
354
-
355
-
356
-
357
-
358
-
359
-
360
-
361
-
362
-
363
-
364
-
365
-
366
 |
 |

156 Consolidated
Financial Statements
at 31 December 2013
Notes
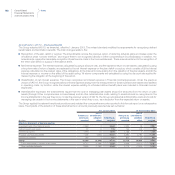
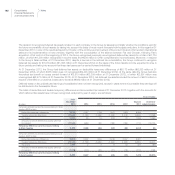
3. Selling, general and administrative costs
Selling costs amount to €4,269 million in 2013 (€4,367 million in 2012) and mainly consist of marketing, advertising, and sales personnel
costs. Marketing and advertising expenses consist primarily of media campaigns, as well as marketing support in the form of trade and auto
shows, events, and sponsorships.
General and administrative costs amount to €2,420 million in 2013 (€2,396 million in 2012) and mainly consist of administration expenses
which are not attributable to sales, manufacturing or research and development functions.
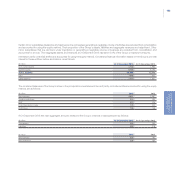
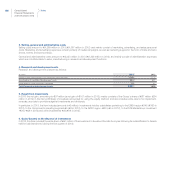
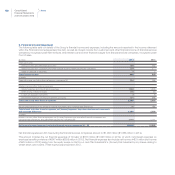
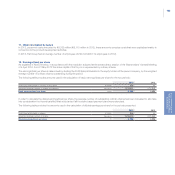
4. Research and development costs
Research and development costs are as follows:
(€ million) 2013 2012
Research and development costs expensed during the year 1,320 1,172
Amortization of capitalized development costs 887 621
Write-down of costs previously capitalized 24 57
Total Research and development costs 2,231 1,850
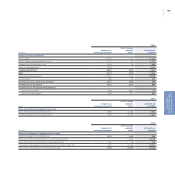
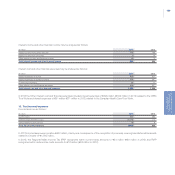
5. Result from investments
In 2013 the net gain, amounting to €97 million (a net gain of €107 million in 2012), mainly consists of the Group’s share of €87 million (€94
million in 2012) in the Net profit/(loss) of investees accounted for using the equity method, and also includes write-downs for impairment,
reversals, accruals to provisions against investments and dividends.
In particular, in 2013, the item includes (amounts in € million): investments held by subsidiaries pertaining to the EMEA region €145 (€160 in
2012), to the Components operating segment €5 (€2 in 2012), to the APAC region -€39 (-€5 in 2012), to the RCS MediaGroup investment
-€34 (-€68 in 2012) and other investments €20 (€18 in 2012).
6. Gains/(losses) on the disposal of investments
In 2012, this item included the write-down of €91 million of the investment in Sevelnord Société Anonyme following its reclassification to Assets
held for sale (transferred during the first quarter of 2013).