Chrysler 2013 Annual Report Download - page 117
Download and view the complete annual report
Please find page 117 of the 2013 Chrysler annual report below. You can navigate through the pages in the report by either clicking on the pages listed below, or by using the keyword search tool below to find specific information within the annual report.-
 1
1 -
2
-
3
-
4
-
5
-
6
-
7
-
8
-
9
-
10
-
11
-
12
-
13
-
14
-
15
-
16
-
17
-
18
-
19
-
20
-
21
-
22
-
23
-
24
-
25
-
26
-
27
-
28
-
29
-
30
-
31
-
32
-
33
-
34
-
35
-
36
-
37
-
38
-
39
-
40
-
41
-
42
-
43
-
44
-
45
-
46
-
47
-
48
-
49
-
50
-
51
-
52
-
53
-
54
-
55
-
56
-
57
-
58
-
59
-
60
-
61
-
62
-
63
-
64
-
65
-
66
-
67
-
68
-
69
-
70
-
71
-
72
-
73
-
74
-
75
-
76
-
77
-
78
-
79
-
80
-
81
-
82
-
83
-
84
-
85
-
86
-
87
-
88
-
89
-
90
-
91
-
92
-
93
-
94
-
95
-
96
-
97
-
98
-
99
-
100
-
101
-
102
-
103
-
104
-
105
-
106
-
 107
107 -
 108
108 -
 109
109 -
 110
110 -
 111
111 -
 112
112 -
 113
113 -
 114
114 -
 115
115 -
 116
116 -
 117
117 -
 118
118 -
 119
119 -
 120
120 -
 121
121 -
 122
122 -
 123
123 -
 124
124 -
 125
125 -
 126
126 -
 127
127 -
128
-
129
-
130
-
131
-
132
-
133
-
134
-
135
-
136
-
137
-
138
-
139
-
140
-
141
-
142
-
143
-
144
-
145
-
146
-
147
-
148
-
149
-
150
-
151
-
152
-
153
-
154
-
155
-
156
-
157
-
158
-
159
-
160
-
161
-
162
-
163
-
164
-
165
-
166
-
167
-
168
-
169
-
170
-
171
-
172
-
173
-
174
-
175
-
176
-
177
-
178
-
179
-
180
-
181
-
182
-
183
-
184
-
185
-
186
-
187
-
188
-
189
-
190
-
191
-
192
-
193
-
194
-
195
-
196
-
197
-
198
-
199
-
200
-
201
-
202
-
203
-
204
-
205
-
206
-
207
-
208
-
209
-
210
-
211
-
212
-
213
-
214
-
215
-
216
-
217
-
218
-
219
-
220
-
221
-
222
-
223
-
224
-
225
-
226
-
227
-
228
-
229
-
230
-
231
-
232
-
233
-
234
-
235
-
236
-
237
-
238
-
239
-
240
-
241
-
242
-
243
-
244
-
245
-
246
-
247
-
248
-
249
-
250
-
251
-
252
-
253
-
254
-
255
-
256
-
257
-
258
-
259
-
260
-
261
-
262
-
263
-
264
-
265
-
266
-
267
-
268
-
269
-
270
-
271
-
272
-
273
-
274
-
275
-
276
-
277
-
278
-
279
-
280
-
281
-
282
-
283
-
284
-
285
-
286
-
287
-
288
-
289
-
290
-
291
-
292
-
293
-
294
-
295
-
296
-
297
-
298
-
299
-
300
-
301
-
302
-
303
-
304
-
305
-
306
-
307
-
308
-
309
-
310
-
311
-
312
-
313
-
314
-
315
-
316
-
317
-
318
-
319
-
320
-
321
-
322
-
323
-
324
-
325
-
326
-
327
-
328
-
329
-
330
-
331
-
332
-
333
-
334
-
335
-
336
-
337
-
338
-
339
-
340
-
341
-
342
-
343
-
344
-
345
-
346
-
347
-
348
-
349
-
350
-
351
-
352
-
353
-
354
-
355
-
356
-
357
-
358
-
359
-
360
-
361
-
362
-
363
-
364
-
365
-
366
 |
 |

116 Report on Operations
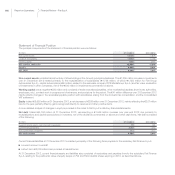
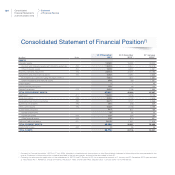
Statement of Financial Position
The principal components of the statement of financial position were as follows:
(€ million) 31.12.2013 31.12.2012
Non-current assets 13,106 11,809
of which: Investments 13,060 11,765
Working capital (220) (261)
NET CAPITAL INVESTED 12,886 11,548
EQUITY 8,693 8,901
NET DEBT 4,193 2,647
Non-current assets consisted almost entirely of shareholdings in the Group’s principal subsidiaries. The €1,295 million increase in investments
over 31 December 2012 related primarily to the recapitalization of subsidiaries (€1,738 million, of which €1,650 million for Fiat Group
Automobiles S.p.A.), capital subscriptions (€94 million related to the associate company RCS MediaGroup S.p.A.) and fair value revaluation
of investments in other companies, net of the €540 million in impairments commented on above.
Working capital was a negative €220 million and consisted of trade receivables/payables, other receivables/payables (from/to tax authorities,
employees, etc.), contract work in progress net of advances, and provisions for the period. The €41 million difference over 31 December 2012
mainly reflects changes in the receivable/payable position with subsidiaries arising from the domestic tax consolidation and the consolidated
VAT settlement.
Equity totaled €8,693 million at 31 December 2013, a net decrease of €208 million over 31 December 2012, mainly reflecting the €227 million
loss for the year, partially offset by gains recognized directly to reserves and other positive items.
A more detailed analysis of changes in equity is provided in the notes to Fiat S.p.A.’s statutory financial statements.
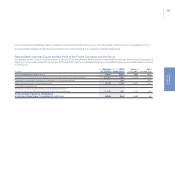
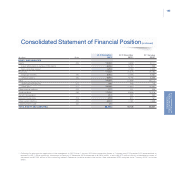
Net debt totaled €4,193 million at 31 December 2013, representing a €1,546 million increase over year-end 2012 due primarily to
recapitalizations and capital subscriptions in investees, net of the dividends commented on above and other cash items. Net debt consisted
of the following:
(€ million) 31.12.2013 31.12.2012
Current financial assets, cash and cash equivalents (1) (59)
Current financial liabilities 3,780 1,294
Non-current financial liabilities 414 1,412
NET DEBT/(CASH) 4,193 2,647
Current financial liabilities at 31 December 2013 consisted principally of the following items payable to the subsidiary Fiat Finance S.p.A.:
a current account overdraft
a short-term €3,000 million loan provided at market terms
At 31 December 2012, current financial assets and liabilities also consisted of receivables and payables from/to the subsidiary Fiat Finance
S.p.A. relating to the positive fair value of equity swaps on Fiat and Fiat Industrial shares expiring in 2013, as described above.
Financial Review – Fiat S.p.A.