Chrysler 2013 Annual Report Download - page 49
Download and view the complete annual report
Please find page 49 of the 2013 Chrysler annual report below. You can navigate through the pages in the report by either clicking on the pages listed below, or by using the keyword search tool below to find specific information within the annual report.-
 1
1 -
2
-
3
-
4
-
5
-
6
-
7
-
8
-
9
-
10
-
11
-
12
-
13
-
14
-
15
-
16
-
17
-
18
-
19
-
20
-
21
-
22
-
23
-
24
-
25
-
26
-
27
-
28
-
29
-
30
-
31
-
32
-
33
-
34
-
35
-
36
-
37
-
38
-
 39
39 -
 40
40 -
 41
41 -
 42
42 -
 43
43 -
 44
44 -
 45
45 -
 46
46 -
 47
47 -
 48
48 -
 49
49 -
 50
50 -
 51
51 -
 52
52 -
 53
53 -
 54
54 -
 55
55 -
 56
56 -
 57
57 -
 58
58 -
 59
59 -
60
-
61
-
62
-
63
-
64
-
65
-
66
-
67
-
68
-
69
-
70
-
71
-
72
-
73
-
74
-
75
-
76
-
77
-
78
-
79
-
80
-
81
-
82
-
83
-
84
-
85
-
86
-
87
-
88
-
89
-
90
-
91
-
92
-
93
-
94
-
95
-
96
-
97
-
98
-
99
-
100
-
101
-
102
-
103
-
104
-
105
-
106
-
107
-
108
-
109
-
110
-
111
-
112
-
113
-
114
-
115
-
116
-
117
-
118
-
119
-
120
-
121
-
122
-
123
-
124
-
125
-
126
-
127
-
128
-
129
-
130
-
131
-
132
-
133
-
134
-
135
-
136
-
137
-
138
-
139
-
140
-
141
-
142
-
143
-
144
-
145
-
146
-
147
-
148
-
149
-
150
-
151
-
152
-
153
-
154
-
155
-
156
-
157
-
158
-
159
-
160
-
161
-
162
-
163
-
164
-
165
-
166
-
167
-
168
-
169
-
170
-
171
-
172
-
173
-
174
-
175
-
176
-
177
-
178
-
179
-
180
-
181
-
182
-
183
-
184
-
185
-
186
-
187
-
188
-
189
-
190
-
191
-
192
-
193
-
194
-
195
-
196
-
197
-
198
-
199
-
200
-
201
-
202
-
203
-
204
-
205
-
206
-
207
-
208
-
209
-
210
-
211
-
212
-
213
-
214
-
215
-
216
-
217
-
218
-
219
-
220
-
221
-
222
-
223
-
224
-
225
-
226
-
227
-
228
-
229
-
230
-
231
-
232
-
233
-
234
-
235
-
236
-
237
-
238
-
239
-
240
-
241
-
242
-
243
-
244
-
245
-
246
-
247
-
248
-
249
-
250
-
251
-
252
-
253
-
254
-
255
-
256
-
257
-
258
-
259
-
260
-
261
-
262
-
263
-
264
-
265
-
266
-
267
-
268
-
269
-
270
-
271
-
272
-
273
-
274
-
275
-
276
-
277
-
278
-
279
-
280
-
281
-
282
-
283
-
284
-
285
-
286
-
287
-
288
-
289
-
290
-
291
-
292
-
293
-
294
-
295
-
296
-
297
-
298
-
299
-
300
-
301
-
302
-
303
-
304
-
305
-
306
-
307
-
308
-
309
-
310
-
311
-
312
-
313
-
314
-
315
-
316
-
317
-
318
-
319
-
320
-
321
-
322
-
323
-
324
-
325
-
326
-
327
-
328
-
329
-
330
-
331
-
332
-
333
-
334
-
335
-
336
-
337
-
338
-
339
-
340
-
341
-
342
-
343
-
344
-
345
-
346
-
347
-
348
-
349
-
350
-
351
-
352
-
353
-
354
-
355
-
356
-
357
-
358
-
359
-
360
-
361
-
362
-
363
-
364
-
365
-
366
 |
 |

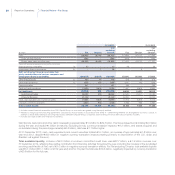
48 Report on Operations
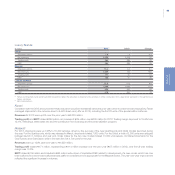
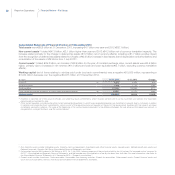
EMEA
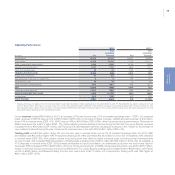
(€ million) 2013 2012(*) Change
Net revenues 17,420 17,800 -380
Trading profit/(loss) (470) (703) 233
EBIT (520) (737) 217
Shipments (000s) 979 1,012 -33
(*) Figures previously reported for 2012 have been restated to reflect application of the amendment to IAS 19. Restatement resulted in trading profit and EBIT being reduced
by €1 million.
Group passenger car and LCV shipments in the EMEA region totaled 979,000 units for the year, a decrease of approximately 33,000 units
(-3%) over 2012.
In 2013, revenues were €17,420 million, decreasing by €380 million or 2% over the prior year. Net of negative currency translation impacts
(€135 million) the decrease was €245 million. Revenues were negatively impacted by a 3% decrease in shipments (€360 million), unfavorable
net pricing (€170 million) and lower volumes for the parts and services business, with lower demand resulting from a decrease in cars on the
road (€140 million). These reductions were partially offset by a €125 million benefit due to favorable product mix, primarily driven by the results
for the 500 family (particularly the 500L), and for LCVs (particularly the Ducato), higher sales of used vehicles (€90 million) and the consolidation
of VM Motori (€210 million).
The trading loss of €470 million for the year was €233 million or 33% lower as compared to the €703 million loss recorded in 2012. The
positive impacts of better product mix (€135 million), driven primarily by results for the 500 family, lower industrial costs (€139 million), driven
by higher industrial efficiencies and purchasing savings, as well as a €199 million reduction in SG&A, more than offset negative net pricing
(€172 million), lower volumes (€58 million) and higher R&D amortization.
EBIT was a negative €520 million. The change over the prior year (-€737 million for 2012) mainly reflected the improved trading profit and
a lower contribution from equity investments (€145 million in 2013 and €160 million in 2012) with unusual charges flat at €195 million. For
2013, unusual charges included the write-off of capitalized R&D related to development on new models for Alfa Romeo, which have now been
switched to a new platform considered technically more appropriate for the brand.
Financial Review – Fiat Group