Chrysler 2013 Annual Report Download - page 125
Download and view the complete annual report
Please find page 125 of the 2013 Chrysler annual report below. You can navigate through the pages in the report by either clicking on the pages listed below, or by using the keyword search tool below to find specific information within the annual report.-
 1
1 -
2
-
3
-
4
-
5
-
6
-
7
-
8
-
9
-
10
-
11
-
12
-
13
-
14
-
15
-
16
-
17
-
18
-
19
-
20
-
21
-
22
-
23
-
24
-
25
-
26
-
27
-
28
-
29
-
30
-
31
-
32
-
33
-
34
-
35
-
36
-
37
-
38
-
39
-
40
-
41
-
42
-
43
-
44
-
45
-
46
-
47
-
48
-
49
-
50
-
51
-
52
-
53
-
54
-
55
-
56
-
57
-
58
-
59
-
60
-
61
-
62
-
63
-
64
-
65
-
66
-
67
-
68
-
69
-
70
-
71
-
72
-
73
-
74
-
75
-
76
-
77
-
78
-
79
-
80
-
81
-
82
-
83
-
84
-
85
-
86
-
87
-
88
-
89
-
90
-
91
-
92
-
93
-
94
-
95
-
96
-
97
-
98
-
99
-
100
-
101
-
102
-
103
-
104
-
105
-
106
-
107
-
108
-
109
-
110
-
111
-
112
-
113
-
114
-
 115
115 -
 116
116 -
 117
117 -
 118
118 -
 119
119 -
 120
120 -
 121
121 -
 122
122 -
 123
123 -
 124
124 -
 125
125 -
 126
126 -
 127
127 -
 128
128 -
 129
129 -
 130
130 -
 131
131 -
 132
132 -
 133
133 -
 134
134 -
 135
135 -
136
-
137
-
138
-
139
-
140
-
141
-
142
-
143
-
144
-
145
-
146
-
147
-
148
-
149
-
150
-
151
-
152
-
153
-
154
-
155
-
156
-
157
-
158
-
159
-
160
-
161
-
162
-
163
-
164
-
165
-
166
-
167
-
168
-
169
-
170
-
171
-
172
-
173
-
174
-
175
-
176
-
177
-
178
-
179
-
180
-
181
-
182
-
183
-
184
-
185
-
186
-
187
-
188
-
189
-
190
-
191
-
192
-
193
-
194
-
195
-
196
-
197
-
198
-
199
-
200
-
201
-
202
-
203
-
204
-
205
-
206
-
207
-
208
-
209
-
210
-
211
-
212
-
213
-
214
-
215
-
216
-
217
-
218
-
219
-
220
-
221
-
222
-
223
-
224
-
225
-
226
-
227
-
228
-
229
-
230
-
231
-
232
-
233
-
234
-
235
-
236
-
237
-
238
-
239
-
240
-
241
-
242
-
243
-
244
-
245
-
246
-
247
-
248
-
249
-
250
-
251
-
252
-
253
-
254
-
255
-
256
-
257
-
258
-
259
-
260
-
261
-
262
-
263
-
264
-
265
-
266
-
267
-
268
-
269
-
270
-
271
-
272
-
273
-
274
-
275
-
276
-
277
-
278
-
279
-
280
-
281
-
282
-
283
-
284
-
285
-
286
-
287
-
288
-
289
-
290
-
291
-
292
-
293
-
294
-
295
-
296
-
297
-
298
-
299
-
300
-
301
-
302
-
303
-
304
-
305
-
306
-
307
-
308
-
309
-
310
-
311
-
312
-
313
-
314
-
315
-
316
-
317
-
318
-
319
-
320
-
321
-
322
-
323
-
324
-
325
-
326
-
327
-
328
-
329
-
330
-
331
-
332
-
333
-
334
-
335
-
336
-
337
-
338
-
339
-
340
-
341
-
342
-
343
-
344
-
345
-
346
-
347
-
348
-
349
-
350
-
351
-
352
-
353
-
354
-
355
-
356
-
357
-
358
-
359
-
360
-
361
-
362
-
363
-
364
-
365
-
366
 |
 |
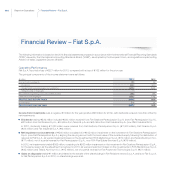
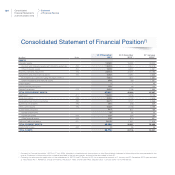
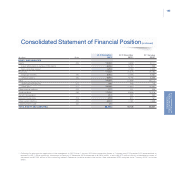
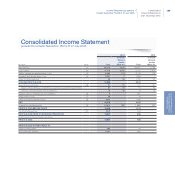
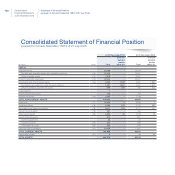
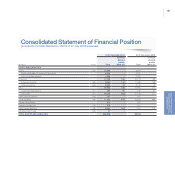
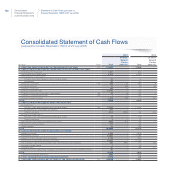
124 Consolidated
Financial Statements
at 31 December 2013
(€ million) Note
At 31 December
2013
At 31 December
2012(**)
At 1 January
2012(**)
ASSETS
Intangible assets 19,509 19,284 18,200
Goodwill and intangible assets with indefinite useful lives (13) 12,439 12,947 13,213
Other intangible assets (14) 7,070 6,337 4,987
Property, plant and equipment (15) 22,843 22,061 20,785
Investments and other financial assets: (16) 2,260 2,287 2,663
Investments accounted for using the equity method 1,561 1,507 1,582
Other investments and financial assets 699 780 1,081
Leased assets 11 45
Defined benefit plan assets 105 93 105
Deferred tax assets (10) 2,893 1,738 1,689
TOTAL NON-CURRENT ASSETS 47,611 45,464 43,487
Inventories (17) 10,230 9,295 9,123
Trade receivables (18) 2,406 2,702 2,625
Receivables from financing activities (18) 3,671 3,727 3,968
Current tax receivables (18) 291 236 369
Other current assets (18) 2,302 2,163 2,088
Current financial assets: 815 807 789
Current investments 35 32 33
Current securities (19) 247 256 199
Other financial assets (20) 533 519 557
Cash and cash equivalents (21) 19,439 17,657 17,526
TOTAL CURRENT ASSETS 39,154 36,587 36,488
Assets held for sale (22) 955 66
TOTAL ASSETS 86,774 82,106 80,041
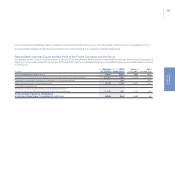
Statement
of Financial Position
Consolidated Statement of Financial Position(*)
(*) Pursuant to Consob Resolution 15519 of 27 July 2006, the effects of related party transactions on the Consolidated statement of financial position are presented in the
specific Statement of financial position schedule provided in the following pages and are further described in Note 31.
(**) Following the retrospective application of the amendment to IAS 19 from 1 January 2013, the comparative amounts at 1 January and 31 December 2012 were restated
as required by IAS 1. Reference should be made to the section “New and revised IFRSs adopted since 1 January 2013” for further details.