Chrysler 2013 Annual Report Download - page 170
Download and view the complete annual report
Please find page 170 of the 2013 Chrysler annual report below. You can navigate through the pages in the report by either clicking on the pages listed below, or by using the keyword search tool below to find specific information within the annual report.-
 1
1 -
2
-
3
-
4
-
5
-
6
-
7
-
8
-
9
-
10
-
11
-
12
-
13
-
14
-
15
-
16
-
17
-
18
-
19
-
20
-
21
-
22
-
23
-
24
-
25
-
26
-
27
-
28
-
29
-
30
-
31
-
32
-
33
-
34
-
35
-
36
-
37
-
38
-
39
-
40
-
41
-
42
-
43
-
44
-
45
-
46
-
47
-
48
-
49
-
50
-
51
-
52
-
53
-
54
-
55
-
56
-
57
-
58
-
59
-
60
-
61
-
62
-
63
-
64
-
65
-
66
-
67
-
68
-
69
-
70
-
71
-
72
-
73
-
74
-
75
-
76
-
77
-
78
-
79
-
80
-
81
-
82
-
83
-
84
-
85
-
86
-
87
-
88
-
89
-
90
-
91
-
92
-
93
-
94
-
95
-
96
-
97
-
98
-
99
-
100
-
101
-
102
-
103
-
104
-
105
-
106
-
107
-
108
-
109
-
110
-
111
-
112
-
113
-
114
-
115
-
116
-
117
-
118
-
119
-
120
-
121
-
122
-
123
-
124
-
125
-
126
-
127
-
128
-
129
-
130
-
131
-
132
-
133
-
134
-
135
-
136
-
137
-
138
-
139
-
140
-
141
-
142
-
143
-
144
-
145
-
146
-
147
-
148
-
149
-
150
-
151
-
152
-
153
-
154
-
155
-
156
-
157
-
158
-
159
-
 160
160 -
 161
161 -
 162
162 -
 163
163 -
 164
164 -
 165
165 -
 166
166 -
 167
167 -
 168
168 -
 169
169 -
 170
170 -
 171
171 -
 172
172 -
 173
173 -
 174
174 -
 175
175 -
 176
176 -
 177
177 -
 178
178 -
 179
179 -
 180
180 -
181
-
182
-
183
-
184
-
185
-
186
-
187
-
188
-
189
-
190
-
191
-
192
-
193
-
194
-
195
-
196
-
197
-
198
-
199
-
200
-
201
-
202
-
203
-
204
-
205
-
206
-
207
-
208
-
209
-
210
-
211
-
212
-
213
-
214
-
215
-
216
-
217
-
218
-
219
-
220
-
221
-
222
-
223
-
224
-
225
-
226
-
227
-
228
-
229
-
230
-
231
-
232
-
233
-
234
-
235
-
236
-
237
-
238
-
239
-
240
-
241
-
242
-
243
-
244
-
245
-
246
-
247
-
248
-
249
-
250
-
251
-
252
-
253
-
254
-
255
-
256
-
257
-
258
-
259
-
260
-
261
-
262
-
263
-
264
-
265
-
266
-
267
-
268
-
269
-
270
-
271
-
272
-
273
-
274
-
275
-
276
-
277
-
278
-
279
-
280
-
281
-
282
-
283
-
284
-
285
-
286
-
287
-
288
-
289
-
290
-
291
-
292
-
293
-
294
-
295
-
296
-
297
-
298
-
299
-
300
-
301
-
302
-
303
-
304
-
305
-
306
-
307
-
308
-
309
-
310
-
311
-
312
-
313
-
314
-
315
-
316
-
317
-
318
-
319
-
320
-
321
-
322
-
323
-
324
-
325
-
326
-
327
-
328
-
329
-
330
-
331
-
332
-
333
-
334
-
335
-
336
-
337
-
338
-
339
-
340
-
341
-
342
-
343
-
344
-
345
-
346
-
347
-
348
-
349
-
350
-
351
-
352
-
353
-
354
-
355
-
356
-
357
-
358
-
359
-
360
-
361
-
362
-
363
-
364
-
365
-
366
 |
 |
169
Consolidated
Financial Statements
at 31 December 2013
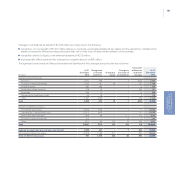
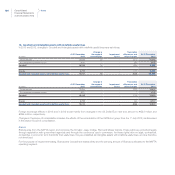
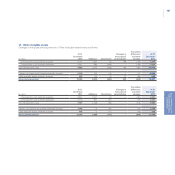
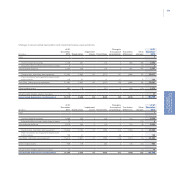
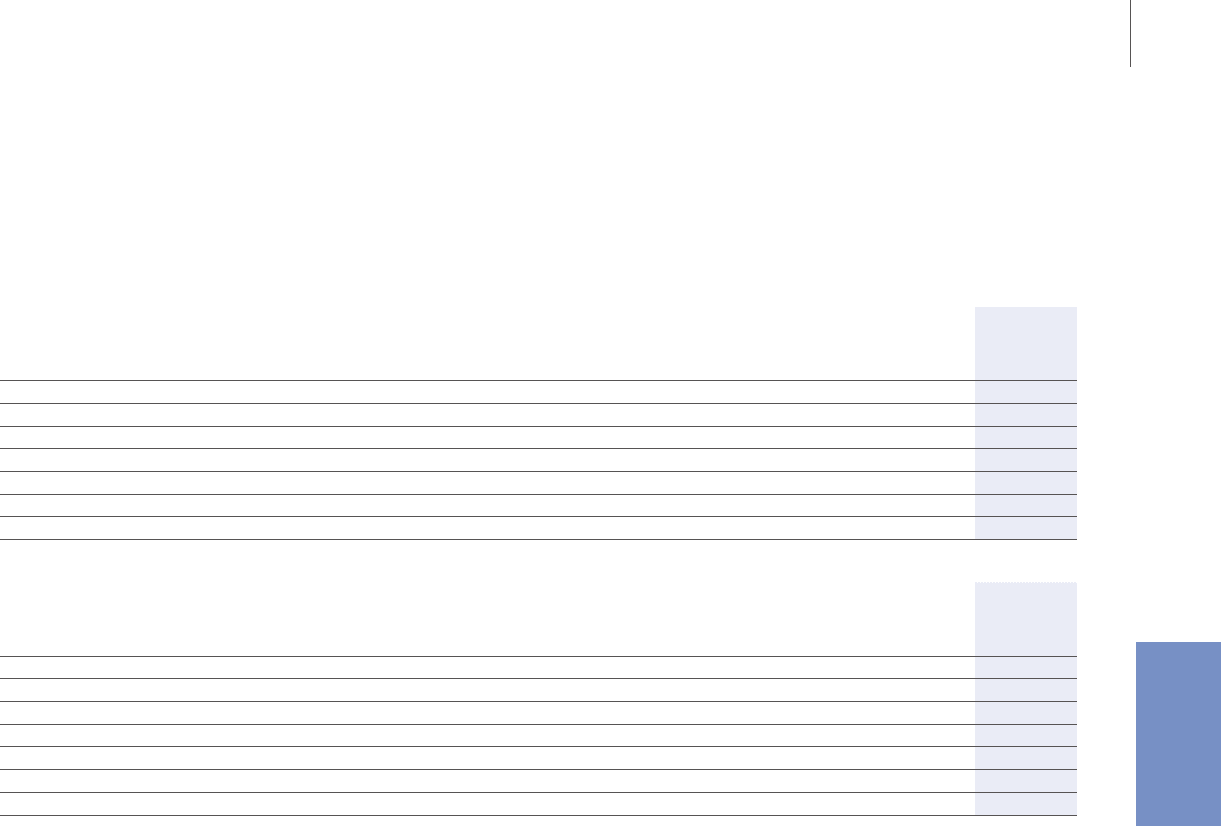
Changes in the net carrying amount of Other intangible assets were as follows:
(€ million)
At 31
December
2012 Additions
Amorti-
zation
Impairment
losses
Divesti-
tures
Change in
the scope
of consoli-
dation
Translation
diff. and
other
changes
At 31
December
2013
Development costs externally acquired 2,791 1,562 (479) (120) (4) 56 (112) 3,694
Development costs internally generated 2,121 480 (408) (130) (18) - (69) 1,976
Total Development costs 4,912 2,042 (887) (250) (22) 56 (181) 5,670
Patents, concessions and licenses externally acquired 1,225 224 (213) - (1) 1 (37) 1,199
Other intangible assets externally acquired 200 64 (46) - (1) 10 (26) 201
Net carrying amount 6,337 2,330 (1,146) (250) (24) 67 (244) 7,070
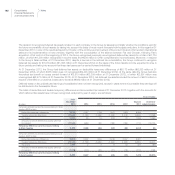
(€ million)
At 31
December
2011 Additions
Amorti-
zation
Impairment
losses
Divesti-
tures
Change in
the scope
of consoli-
dation
Translation
diff. and
other
changes
At 31
December
2012
Development costs externally acquired 1,561 1,547 (234) (19) (4) - (60) 2,791
Development costs internally generated 1,959 591 (387) (38) (6) - 2 2,121
Total Development costs 3,520 2,138 (621) (57) (10) - (58) 4,912
Patents, concessions and licenses externally acquired 1,277 175 (208) - (1) - (18) 1,225
Other intangible assets externally acquired 190 72 (52) (1) (1) - (8) 200
Net carrying amount 4,987 2,385 (881) (58) (12) - (84) 6,337
Additions of €2,330 million in 2013 (€2,385 million in 2012) include development costs of €2,042 million (€2,138 million in 2012), consisting
primarily of material costs and personnel related expenses relating to engineering, design and development focused on content enhancement
of existing vehicles, new models and powertrain programs in NAFTA and EMEA region.
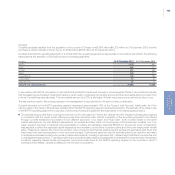
In 2013, to reflect the new product strategy the Group wrote-down certain Development costs by €250 million (€57 million in 2012). This
amount mainly includes €151 million for the EMEA region, €32 million for the LATAM region and €65 million for Maserati in connection
with development costs on new Alfa Romeo, Fiat and Maserati products, which have now been switched to new platforms considered
technologically more appropriate. These write-downs of Development costs have been recognized as Other unusual expenses for €226
million. In 2012, the write-down was recognized within Trading profit/(loss), as this was not related to strategic factors.
Changes in the scope of consolidation amounted to €67 million mainly includes the effects of the consolidation of the VM Motori group, as
discussed in the section Scope of consolidation.
Foreign exchange losses of €242 million in 2013 principally reflect the changes in the US Dollar and Brazilian Real against the Euro. Foreign
exchange losses of €87 million in 2012 principally reflected the devaluation of the US Dollar and Brazilian Real against the Euro, partially offset
by the appreciation of the Polish Zloty against the Euro.