Chrysler 2013 Annual Report Download - page 128
Download and view the complete annual report
Please find page 128 of the 2013 Chrysler annual report below. You can navigate through the pages in the report by either clicking on the pages listed below, or by using the keyword search tool below to find specific information within the annual report.-
 1
1 -
2
-
3
-
4
-
5
-
6
-
7
-
8
-
9
-
10
-
11
-
12
-
13
-
14
-
15
-
16
-
17
-
18
-
19
-
20
-
21
-
22
-
23
-
24
-
25
-
26
-
27
-
28
-
29
-
30
-
31
-
32
-
33
-
34
-
35
-
36
-
37
-
38
-
39
-
40
-
41
-
42
-
43
-
44
-
45
-
46
-
47
-
48
-
49
-
50
-
51
-
52
-
53
-
54
-
55
-
56
-
57
-
58
-
59
-
60
-
61
-
62
-
63
-
64
-
65
-
66
-
67
-
68
-
69
-
70
-
71
-
72
-
73
-
74
-
75
-
76
-
77
-
78
-
79
-
80
-
81
-
82
-
83
-
84
-
85
-
86
-
87
-
88
-
89
-
90
-
91
-
92
-
93
-
94
-
95
-
96
-
97
-
98
-
99
-
100
-
101
-
102
-
103
-
104
-
105
-
106
-
107
-
108
-
109
-
110
-
111
-
112
-
113
-
114
-
115
-
116
-
117
-
 118
118 -
 119
119 -
 120
120 -
 121
121 -
 122
122 -
 123
123 -
 124
124 -
 125
125 -
 126
126 -
 127
127 -
 128
128 -
 129
129 -
 130
130 -
 131
131 -
 132
132 -
 133
133 -
 134
134 -
 135
135 -
 136
136 -
 137
137 -
 138
138 -
139
-
140
-
141
-
142
-
143
-
144
-
145
-
146
-
147
-
148
-
149
-
150
-
151
-
152
-
153
-
154
-
155
-
156
-
157
-
158
-
159
-
160
-
161
-
162
-
163
-
164
-
165
-
166
-
167
-
168
-
169
-
170
-
171
-
172
-
173
-
174
-
175
-
176
-
177
-
178
-
179
-
180
-
181
-
182
-
183
-
184
-
185
-
186
-
187
-
188
-
189
-
190
-
191
-
192
-
193
-
194
-
195
-
196
-
197
-
198
-
199
-
200
-
201
-
202
-
203
-
204
-
205
-
206
-
207
-
208
-
209
-
210
-
211
-
212
-
213
-
214
-
215
-
216
-
217
-
218
-
219
-
220
-
221
-
222
-
223
-
224
-
225
-
226
-
227
-
228
-
229
-
230
-
231
-
232
-
233
-
234
-
235
-
236
-
237
-
238
-
239
-
240
-
241
-
242
-
243
-
244
-
245
-
246
-
247
-
248
-
249
-
250
-
251
-
252
-
253
-
254
-
255
-
256
-
257
-
258
-
259
-
260
-
261
-
262
-
263
-
264
-
265
-
266
-
267
-
268
-
269
-
270
-
271
-
272
-
273
-
274
-
275
-
276
-
277
-
278
-
279
-
280
-
281
-
282
-
283
-
284
-
285
-
286
-
287
-
288
-
289
-
290
-
291
-
292
-
293
-
294
-
295
-
296
-
297
-
298
-
299
-
300
-
301
-
302
-
303
-
304
-
305
-
306
-
307
-
308
-
309
-
310
-
311
-
312
-
313
-
314
-
315
-
316
-
317
-
318
-
319
-
320
-
321
-
322
-
323
-
324
-
325
-
326
-
327
-
328
-
329
-
330
-
331
-
332
-
333
-
334
-
335
-
336
-
337
-
338
-
339
-
340
-
341
-
342
-
343
-
344
-
345
-
346
-
347
-
348
-
349
-
350
-
351
-
352
-
353
-
354
-
355
-
356
-
357
-
358
-
359
-
360
-
361
-
362
-
363
-
364
-
365
-
366
 |
 |

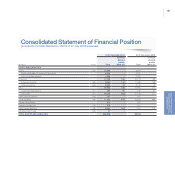
127
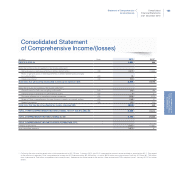
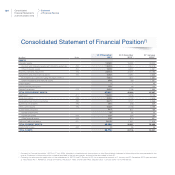
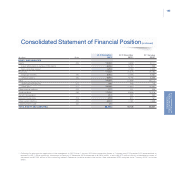
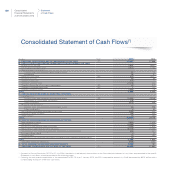
Consolidated
Financial Statements
at 31 December 2013
Consolidated
Financial Statements
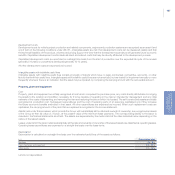
at 31 December 2013
(€ million)
Share
capital
Treasury
shares
Capital
reserves
Earnings
reserves
Cash
flow
hedge
reserve
Cumulative
translation
adjustment
reserve
Available
for sale
financial
assets
reserve
Remeasu-
rement of
defined
benefit plans
reserve
Cumulative
share
of OCI of
entities
consolidated
under
the equity
method
Non-
controlling
interests Total
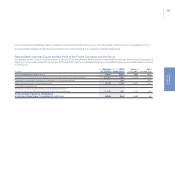
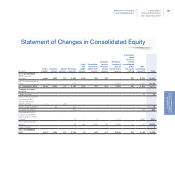
AT 31 DECEMBER
2011 (Reported
amounts) 4,466 (289) 147 3,862 (170) 834 (43) - (80) 3,533 12,260
IAS 19 revised adoption
effect - - - (79) - - - (1,287) (3) (1,180) (2,549)
AT 1 JANUARY 2012 4,466 (289) 147 3,783 (170) 834 (43) (1,287) (83) 2,353 9,711
Changes in equity
for 2012:
Capital increase - - - - - - - - - 22 22
Effect of the conversion
of preference and
savings shares into
ordinary shares 10 - (10) - - - - - - - -
Share based payments - 30 - (15) - - - - - - 15
Dividends distributed - - - (40) - - - - - (18) (58)
Purchase and sale of
shares in subsidiaries
from/to non-controlling
interests - - - 22 1 3 - (114) - (232) (320)
Total comprehensive
income - - - 44 184 (204) 26 (1,133) 21 57 (1,005)
Other changes - - - 4 - - - - - - 4
AT 31 DECEMBER
2012 4,476 (259) 137 3,798 15 633 (17) (2,534) (62) 2,182 8,369
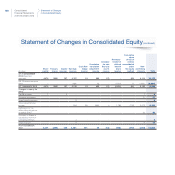
Statement of Changes
in Consolidated Equity
Statement of Changes in Consolidated Equity