Chrysler 2013 Annual Report Download - page 180
Download and view the complete annual report
Please find page 180 of the 2013 Chrysler annual report below. You can navigate through the pages in the report by either clicking on the pages listed below, or by using the keyword search tool below to find specific information within the annual report.-
 1
1 -
2
-
3
-
4
-
5
-
6
-
7
-
8
-
9
-
10
-
11
-
12
-
13
-
14
-
15
-
16
-
17
-
18
-
19
-
20
-
21
-
22
-
23
-
24
-
25
-
26
-
27
-
28
-
29
-
30
-
31
-
32
-
33
-
34
-
35
-
36
-
37
-
38
-
39
-
40
-
41
-
42
-
43
-
44
-
45
-
46
-
47
-
48
-
49
-
50
-
51
-
52
-
53
-
54
-
55
-
56
-
57
-
58
-
59
-
60
-
61
-
62
-
63
-
64
-
65
-
66
-
67
-
68
-
69
-
70
-
71
-
72
-
73
-
74
-
75
-
76
-
77
-
78
-
79
-
80
-
81
-
82
-
83
-
84
-
85
-
86
-
87
-
88
-
89
-
90
-
91
-
92
-
93
-
94
-
95
-
96
-
97
-
98
-
99
-
100
-
101
-
102
-
103
-
104
-
105
-
106
-
107
-
108
-
109
-
110
-
111
-
112
-
113
-
114
-
115
-
116
-
117
-
118
-
119
-
120
-
121
-
122
-
123
-
124
-
125
-
126
-
127
-
128
-
129
-
130
-
131
-
132
-
133
-
134
-
135
-
136
-
137
-
138
-
139
-
140
-
141
-
142
-
143
-
144
-
145
-
146
-
147
-
148
-
149
-
150
-
151
-
152
-
153
-
154
-
155
-
156
-
157
-
158
-
159
-
160
-
161
-
162
-
163
-
164
-
165
-
166
-
167
-
168
-
169
-
 170
170 -
 171
171 -
 172
172 -
 173
173 -
 174
174 -
 175
175 -
 176
176 -
 177
177 -
 178
178 -
 179
179 -
 180
180 -
 181
181 -
 182
182 -
 183
183 -
 184
184 -
 185
185 -
 186
186 -
 187
187 -
 188
188 -
 189
189 -
 190
190 -
191
-
192
-
193
-
194
-
195
-
196
-
197
-
198
-
199
-
200
-
201
-
202
-
203
-
204
-
205
-
206
-
207
-
208
-
209
-
210
-
211
-
212
-
213
-
214
-
215
-
216
-
217
-
218
-
219
-
220
-
221
-
222
-
223
-
224
-
225
-
226
-
227
-
228
-
229
-
230
-
231
-
232
-
233
-
234
-
235
-
236
-
237
-
238
-
239
-
240
-
241
-
242
-
243
-
244
-
245
-
246
-
247
-
248
-
249
-
250
-
251
-
252
-
253
-
254
-
255
-
256
-
257
-
258
-
259
-
260
-
261
-
262
-
263
-
264
-
265
-
266
-
267
-
268
-
269
-
270
-
271
-
272
-
273
-
274
-
275
-
276
-
277
-
278
-
279
-
280
-
281
-
282
-
283
-
284
-
285
-
286
-
287
-
288
-
289
-
290
-
291
-
292
-
293
-
294
-
295
-
296
-
297
-
298
-
299
-
300
-
301
-
302
-
303
-
304
-
305
-
306
-
307
-
308
-
309
-
310
-
311
-
312
-
313
-
314
-
315
-
316
-
317
-
318
-
319
-
320
-
321
-
322
-
323
-
324
-
325
-
326
-
327
-
328
-
329
-
330
-
331
-
332
-
333
-
334
-
335
-
336
-
337
-
338
-
339
-
340
-
341
-
342
-
343
-
344
-
345
-
346
-
347
-
348
-
349
-
350
-
351
-
352
-
353
-
354
-
355
-
356
-
357
-
358
-
359
-
360
-
361
-
362
-
363
-
364
-
365
-
366
 |
 |

179
Consolidated
Financial Statements
at 31 December 2013
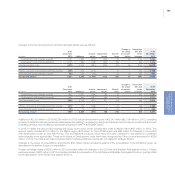
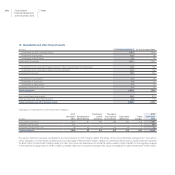
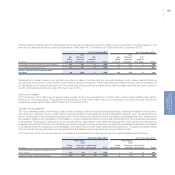
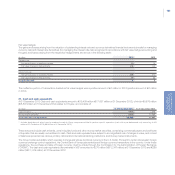
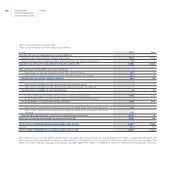
Finance lease receivables refer to vehicles leased out under finance lease arrangements, mainly by the Luxury Brands operating segment. This
item may be analyzed as follows, gross of an allowance of €5 million at 31 December 2013 (€5 million at 31 December 2012):
At 31 December 2013 At 31 December 2012
(€ million)
due
within
one year
due
between
one and
five years
due
beyond
five years Total
due
within
one year
due
between
one and
five years
due
beyond
five years Total
Receivables for future minimum lease payments 104 223 8 335 123 236 5 364
Less: unrealized interest income (14) (18) (1) (33) (11) (17) - (28)
Present value of future minimum lease
payments 90 205 7 302 112 219 5 336
Receivables for dealer financing are typically generated by sales of vehicles and are generally managed under dealer network financing
programs as a component of the portfolio of the financial services companies. These receivables are interest bearing, with the exception of
an initial limited, non-interest bearing period. The contractual terms governing the relationships with the dealer networks vary from country to
country, although payment terms range from two to six months.
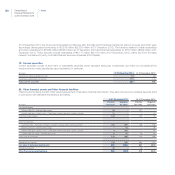
Other current assets
At 31 December 2013, Other current assets mainly consist of Other tax receivables for VAT and other indirect taxes of €966 million (€871
million at 31 December 2012), Receivables from employees of €150 million (€76 million at 31 December 2012) and Accrued income and
prepaid expenses of €442 million (€387 million at 31 December 2012).
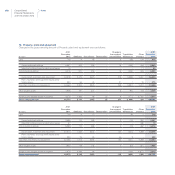
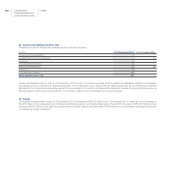
Transfer of financial assets
The Group transfers certain of its financial, trade and tax receivables, mainly through factoring transactions. Factoring transactions may be either
with recourse or without recourse; certain without recourse transfers include deferred payment clauses (for example, when the payment by the
factor of a minor part of the purchase price is dependent on the total amount collected from the receivables), requiring first loss cover, meaning that
the transferor takes priority participation in the losses, or require a significant exposure to the cash flows arising from the transferred receivables
to be retained. These types of transactions do not comply with the requirements of IAS 39 for the derecognition of the assets since the risks and
rewards connected with collection are not transferred, and accordingly the Group continues to recognize the receivables transferred by this means
in its balance sheet and recognizes a financial liability of the same amount under Asset-backed financing (Note 27). The gains and losses arising
from the transfer of these assets are only recognized when the assets are derecognized in the Group’s balance sheet.
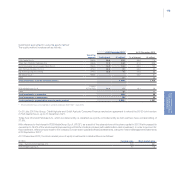
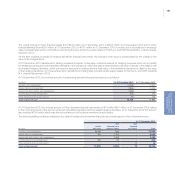
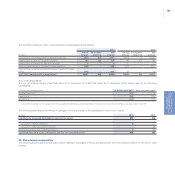
At 31 December 2013, the carrying amount of transferred financial assets not derecognized and the related liabilities was as follows:
At 31 December 2013 At 31 December 2012
(€ million)
Trade
receivables
Receivables
from
financing
activities
Current tax
receivables Total
Trade
receivables
Receivables
from
financing
activities
Current tax
receivables Total
Carrying amount of assets transferred and not
derecognized 123 440 33 596 9 405 35 449
Carrying amount of the related liabilities 123 440 33 596 9 405 35 449