Chrysler 2013 Annual Report Download - page 51
Download and view the complete annual report
Please find page 51 of the 2013 Chrysler annual report below. You can navigate through the pages in the report by either clicking on the pages listed below, or by using the keyword search tool below to find specific information within the annual report.-
 1
1 -
2
-
3
-
4
-
5
-
6
-
7
-
8
-
9
-
10
-
11
-
12
-
13
-
14
-
15
-
16
-
17
-
18
-
19
-
20
-
21
-
22
-
23
-
24
-
25
-
26
-
27
-
28
-
29
-
30
-
31
-
32
-
33
-
34
-
35
-
36
-
37
-
38
-
39
-
40
-
 41
41 -
 42
42 -
 43
43 -
 44
44 -
 45
45 -
 46
46 -
 47
47 -
 48
48 -
 49
49 -
 50
50 -
 51
51 -
 52
52 -
 53
53 -
 54
54 -
 55
55 -
 56
56 -
 57
57 -
 58
58 -
 59
59 -
 60
60 -
 61
61 -
62
-
63
-
64
-
65
-
66
-
67
-
68
-
69
-
70
-
71
-
72
-
73
-
74
-
75
-
76
-
77
-
78
-
79
-
80
-
81
-
82
-
83
-
84
-
85
-
86
-
87
-
88
-
89
-
90
-
91
-
92
-
93
-
94
-
95
-
96
-
97
-
98
-
99
-
100
-
101
-
102
-
103
-
104
-
105
-
106
-
107
-
108
-
109
-
110
-
111
-
112
-
113
-
114
-
115
-
116
-
117
-
118
-
119
-
120
-
121
-
122
-
123
-
124
-
125
-
126
-
127
-
128
-
129
-
130
-
131
-
132
-
133
-
134
-
135
-
136
-
137
-
138
-
139
-
140
-
141
-
142
-
143
-
144
-
145
-
146
-
147
-
148
-
149
-
150
-
151
-
152
-
153
-
154
-
155
-
156
-
157
-
158
-
159
-
160
-
161
-
162
-
163
-
164
-
165
-
166
-
167
-
168
-
169
-
170
-
171
-
172
-
173
-
174
-
175
-
176
-
177
-
178
-
179
-
180
-
181
-
182
-
183
-
184
-
185
-
186
-
187
-
188
-
189
-
190
-
191
-
192
-
193
-
194
-
195
-
196
-
197
-
198
-
199
-
200
-
201
-
202
-
203
-
204
-
205
-
206
-
207
-
208
-
209
-
210
-
211
-
212
-
213
-
214
-
215
-
216
-
217
-
218
-
219
-
220
-
221
-
222
-
223
-
224
-
225
-
226
-
227
-
228
-
229
-
230
-
231
-
232
-
233
-
234
-
235
-
236
-
237
-
238
-
239
-
240
-
241
-
242
-
243
-
244
-
245
-
246
-
247
-
248
-
249
-
250
-
251
-
252
-
253
-
254
-
255
-
256
-
257
-
258
-
259
-
260
-
261
-
262
-
263
-
264
-
265
-
266
-
267
-
268
-
269
-
270
-
271
-
272
-
273
-
274
-
275
-
276
-
277
-
278
-
279
-
280
-
281
-
282
-
283
-
284
-
285
-
286
-
287
-
288
-
289
-
290
-
291
-
292
-
293
-
294
-
295
-
296
-
297
-
298
-
299
-
300
-
301
-
302
-
303
-
304
-
305
-
306
-
307
-
308
-
309
-
310
-
311
-
312
-
313
-
314
-
315
-
316
-
317
-
318
-
319
-
320
-
321
-
322
-
323
-
324
-
325
-
326
-
327
-
328
-
329
-
330
-
331
-
332
-
333
-
334
-
335
-
336
-
337
-
338
-
339
-
340
-
341
-
342
-
343
-
344
-
345
-
346
-
347
-
348
-
349
-
350
-
351
-
352
-
353
-
354
-
355
-
356
-
357
-
358
-
359
-
360
-
361
-
362
-
363
-
364
-
365
-
366
 |
 |

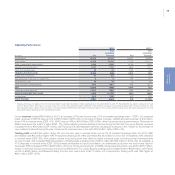
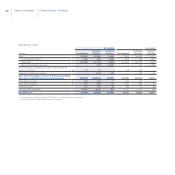
50 Report on Operations
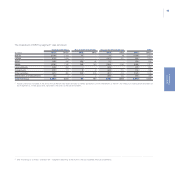
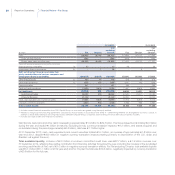
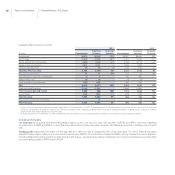
Components
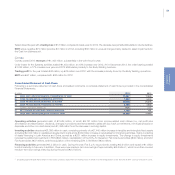
(€ million) 2013 2012 Change
Magneti Marelli
Net revenues 5,988 5,828 160
Trading profit 166 141(1) 25
EBIT 169 131(1) 38
Teksid
Net revenues 688 780 -92
Trading profit/(loss) (13) - -13
EBIT (70) 4 -74
Comau
Net revenues 1,463 1,482 -19
Trading profit 48 33(1) 15
EBIT 47 30(1) 17
COMPONENTS
Net revenues (2) 8,080 8,030 50
Trading profit 201 174(1) 27
EBIT 146 165(1) -19
(1) The figures previously reported for 2012 have been restated to reflect application of the amendment to IAS 19. Restatement resulted in total Trading Profit and EBIT for
Components being reduced by €2 million (+€1 million for Magneti Marelli and -€3 million for Comau).
(2) Net of eliminations.
Magneti Marelli
Magneti Marelli reported revenues of €5,988 million, an increase of 3% over the prior year (6% at constant exchange rates), driven by performance
in NAFTA and China, in addition to a modest gain in Europe. In Brazil, revenues were substantially in line with 2012 on a constant currency basis.
The Lighting business line posted a 12% increase in revenues on the back of performance in China and in NAFTA, which benefited from the
full-year contribution of several new products that were launched during the second half of 2012. For the Electronic Systems business line,
revenues were 7% higher primarily due to growth in sales of telematics and body products. For the Powertrain business line, revenues were in
line with the prior year on a constant currency basis. The After Market business line posted a 5% increase in revenues (CER +13%) with growth
in Europe and Mercosur only partially offset by a decrease in NAFTA.
Trading profit totaled €166 million, compared with €141 million for 2012, with top-line growth only partially offset by higher costs associated
with new product launches in NAFTA.
EBIT was €169 million, an increase of €38 million over the prior year reflecting higher trading profit and the non-repeat of unusual charges
recognized in 2012.
Teksid
Revenues totaled €688 million, down 12% over the prior year.
The Cast Iron business unit posted a 7% decrease in volumes in Europe and the Americas, with demand lower in all market segments,
particularly light vehicles. For the Aluminum business unit, volumes were up 13% year-over-year.
Financial Review – Fiat Group