Chrysler 2013 Annual Report Download - page 216
Download and view the complete annual report
Please find page 216 of the 2013 Chrysler annual report below. You can navigate through the pages in the report by either clicking on the pages listed below, or by using the keyword search tool below to find specific information within the annual report.-
 1
1 -
2
-
3
-
4
-
5
-
6
-
7
-
8
-
9
-
10
-
11
-
12
-
13
-
14
-
15
-
16
-
17
-
18
-
19
-
20
-
21
-
22
-
23
-
24
-
25
-
26
-
27
-
28
-
29
-
30
-
31
-
32
-
33
-
34
-
35
-
36
-
37
-
38
-
39
-
40
-
41
-
42
-
43
-
44
-
45
-
46
-
47
-
48
-
49
-
50
-
51
-
52
-
53
-
54
-
55
-
56
-
57
-
58
-
59
-
60
-
61
-
62
-
63
-
64
-
65
-
66
-
67
-
68
-
69
-
70
-
71
-
72
-
73
-
74
-
75
-
76
-
77
-
78
-
79
-
80
-
81
-
82
-
83
-
84
-
85
-
86
-
87
-
88
-
89
-
90
-
91
-
92
-
93
-
94
-
95
-
96
-
97
-
98
-
99
-
100
-
101
-
102
-
103
-
104
-
105
-
106
-
107
-
108
-
109
-
110
-
111
-
112
-
113
-
114
-
115
-
116
-
117
-
118
-
119
-
120
-
121
-
122
-
123
-
124
-
125
-
126
-
127
-
128
-
129
-
130
-
131
-
132
-
133
-
134
-
135
-
136
-
137
-
138
-
139
-
140
-
141
-
142
-
143
-
144
-
145
-
146
-
147
-
148
-
149
-
150
-
151
-
152
-
153
-
154
-
155
-
156
-
157
-
158
-
159
-
160
-
161
-
162
-
163
-
164
-
165
-
166
-
167
-
168
-
169
-
170
-
171
-
172
-
173
-
174
-
175
-
176
-
177
-
178
-
179
-
180
-
181
-
182
-
183
-
184
-
185
-
186
-
187
-
188
-
189
-
190
-
191
-
192
-
193
-
194
-
195
-
196
-
197
-
198
-
199
-
200
-
201
-
202
-
203
-
204
-
205
-
 206
206 -
 207
207 -
 208
208 -
 209
209 -
 210
210 -
 211
211 -
 212
212 -
 213
213 -
 214
214 -
 215
215 -
 216
216 -
 217
217 -
 218
218 -
 219
219 -
 220
220 -
 221
221 -
 222
222 -
 223
223 -
 224
224 -
 225
225 -
 226
226 -
227
-
228
-
229
-
230
-
231
-
232
-
233
-
234
-
235
-
236
-
237
-
238
-
239
-
240
-
241
-
242
-
243
-
244
-
245
-
246
-
247
-
248
-
249
-
250
-
251
-
252
-
253
-
254
-
255
-
256
-
257
-
258
-
259
-
260
-
261
-
262
-
263
-
264
-
265
-
266
-
267
-
268
-
269
-
270
-
271
-
272
-
273
-
274
-
275
-
276
-
277
-
278
-
279
-
280
-
281
-
282
-
283
-
284
-
285
-
286
-
287
-
288
-
289
-
290
-
291
-
292
-
293
-
294
-
295
-
296
-
297
-
298
-
299
-
300
-
301
-
302
-
303
-
304
-
305
-
306
-
307
-
308
-
309
-
310
-
311
-
312
-
313
-
314
-
315
-
316
-
317
-
318
-
319
-
320
-
321
-
322
-
323
-
324
-
325
-
326
-
327
-
328
-
329
-
330
-
331
-
332
-
333
-
334
-
335
-
336
-
337
-
338
-
339
-
340
-
341
-
342
-
343
-
344
-
345
-
346
-
347
-
348
-
349
-
350
-
351
-
352
-
353
-
354
-
355
-
356
-
357
-
358
-
359
-
360
-
361
-
362
-
363
-
364
-
365
-
366
 |
 |
215
Consolidated
Financial Statements
at 31 December 2013
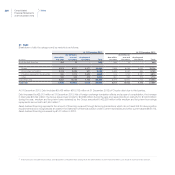
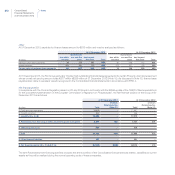
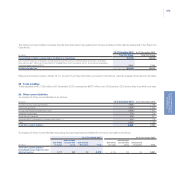
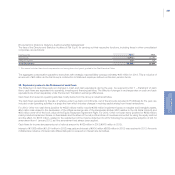
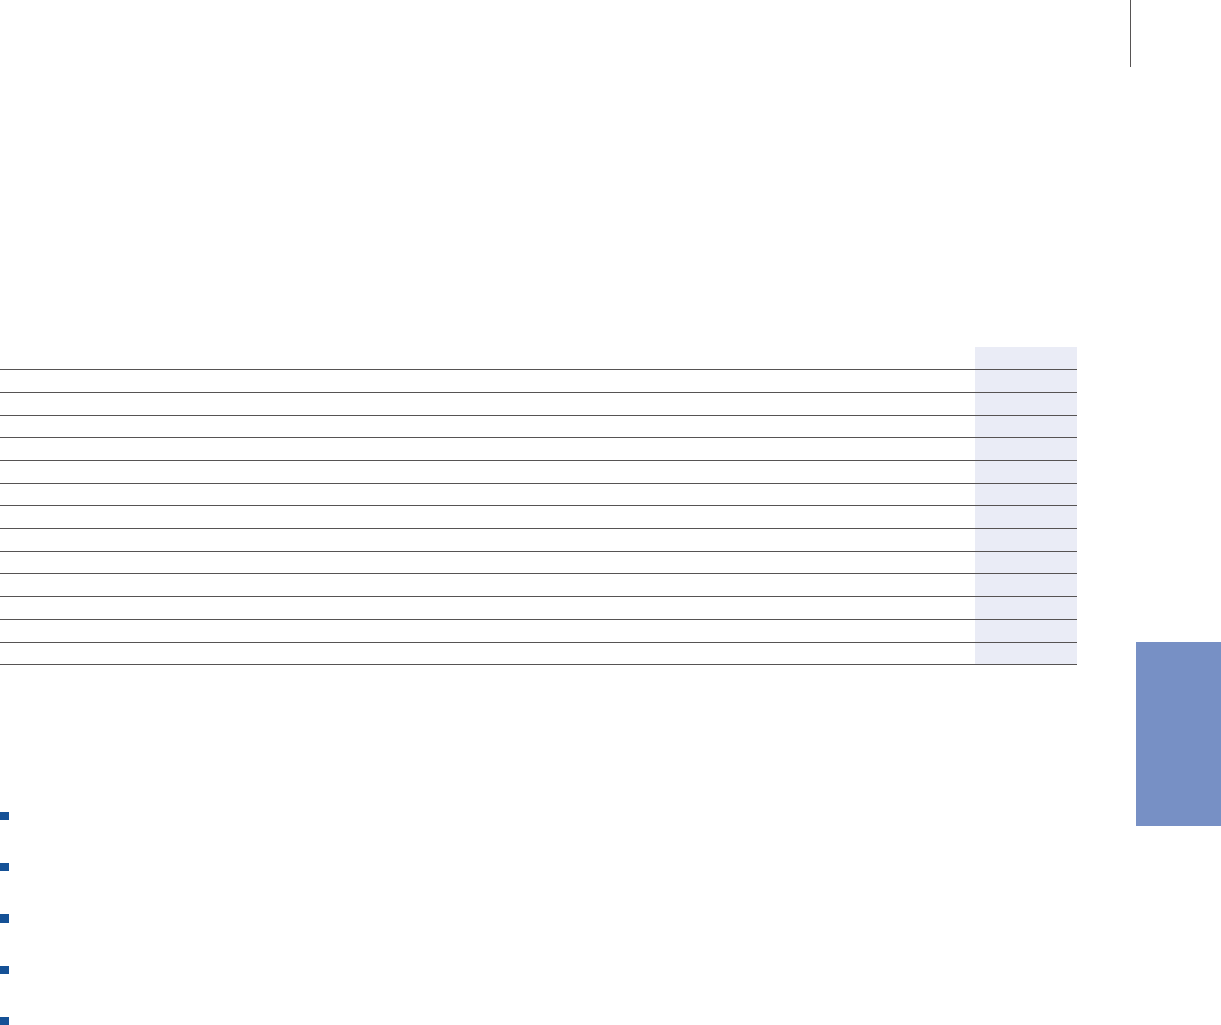
Assets and liabilities that are measured at fair value on a recurring basis
The following table shows the fair value hierarchy for financial assets and liabilities that are measured at fair value on a recurring basis at 31
December 2013:
(€ million) Note Level 1 Level 2 Level 3 Total
Assets at fair value available for sale:
Investments at fair value with changes directly in Other comprehensive income/(losses) (16) 134 14 - 148
Investments at fair value through profit or loss (16) 151 - - 151
Other non-current securities (16) 42 - 12 54
Current securities available-for-sale (19) 92 - - 92
Financial assets at fair value held-for-trading:
Current investments 35 - - 35
Current securities held for trading (19) 155 - - 155
Other financial assets (20) 20 509 4 533
Cash and cash equivalents (21) 18,498 941 - 19,439
Total Assets 19,127 1,464 16 20,607
Other financial liabilities (20) -135 2 137
Total Liabilities - 135 2 137
In 2013, there were no transfers between Levels in the fair value hierarchy.
The fair value of Other financial assets and liabilities that are mainly composed by derivatives financial instruments is measured by taking
into consideration market parameters at the balance sheet date and using valuation techniques widely accepted in the financial business
environment. In particular:
the fair value of forward contracts and currency swaps is determined by taking the prevailing exchange rate and interest rates at the balance
sheet date;
the fair value of interest rate swaps and forward rate agreements is determined by taking the prevailing interest rates at the balance sheet
date and using the discounted expected cash flow method;
the fair value of combined interest rate and currency swaps is determined using the exchange and interest rates prevailing at the balance
sheet date and the discounted expected cash flow method;
the fair value of swaps and options hedging commodity price risk is determined by using suitable valuation techniques and taking market
parameters at the balance sheet date (in particular, underline prices, interest rates and volatility rates);
the fair value of equity swaps is determined using market prices at the balance sheet date.
The par value of Cash and cash equivalents usually approximates fair value due to the short maturity of these instruments, which consist
primarily of bank current accounts and time deposits, certificates of deposit, commercial paper, bankers’ acceptances and money market
funds. Money market funds valuation is also based on available market quotations. Where appropriate, the fair value of Cash equivalents is
determined with discounted expected cash flow techniques, using observable market yields (represented in level 2 above).