Chrysler 2013 Annual Report Download - page 60
Download and view the complete annual report
Please find page 60 of the 2013 Chrysler annual report below. You can navigate through the pages in the report by either clicking on the pages listed below, or by using the keyword search tool below to find specific information within the annual report.-
 1
1 -
2
-
3
-
4
-
5
-
6
-
7
-
8
-
9
-
10
-
11
-
12
-
13
-
14
-
15
-
16
-
17
-
18
-
19
-
20
-
21
-
22
-
23
-
24
-
25
-
26
-
27
-
28
-
29
-
30
-
31
-
32
-
33
-
34
-
35
-
36
-
37
-
38
-
39
-
40
-
41
-
42
-
43
-
44
-
45
-
46
-
47
-
48
-
49
-
 50
50 -
 51
51 -
 52
52 -
 53
53 -
 54
54 -
 55
55 -
 56
56 -
 57
57 -
 58
58 -
 59
59 -
 60
60 -
 61
61 -
 62
62 -
 63
63 -
 64
64 -
 65
65 -
 66
66 -
 67
67 -
 68
68 -
 69
69 -
 70
70 -
71
-
72
-
73
-
74
-
75
-
76
-
77
-
78
-
79
-
80
-
81
-
82
-
83
-
84
-
85
-
86
-
87
-
88
-
89
-
90
-
91
-
92
-
93
-
94
-
95
-
96
-
97
-
98
-
99
-
100
-
101
-
102
-
103
-
104
-
105
-
106
-
107
-
108
-
109
-
110
-
111
-
112
-
113
-
114
-
115
-
116
-
117
-
118
-
119
-
120
-
121
-
122
-
123
-
124
-
125
-
126
-
127
-
128
-
129
-
130
-
131
-
132
-
133
-
134
-
135
-
136
-
137
-
138
-
139
-
140
-
141
-
142
-
143
-
144
-
145
-
146
-
147
-
148
-
149
-
150
-
151
-
152
-
153
-
154
-
155
-
156
-
157
-
158
-
159
-
160
-
161
-
162
-
163
-
164
-
165
-
166
-
167
-
168
-
169
-
170
-
171
-
172
-
173
-
174
-
175
-
176
-
177
-
178
-
179
-
180
-
181
-
182
-
183
-
184
-
185
-
186
-
187
-
188
-
189
-
190
-
191
-
192
-
193
-
194
-
195
-
196
-
197
-
198
-
199
-
200
-
201
-
202
-
203
-
204
-
205
-
206
-
207
-
208
-
209
-
210
-
211
-
212
-
213
-
214
-
215
-
216
-
217
-
218
-
219
-
220
-
221
-
222
-
223
-
224
-
225
-
226
-
227
-
228
-
229
-
230
-
231
-
232
-
233
-
234
-
235
-
236
-
237
-
238
-
239
-
240
-
241
-
242
-
243
-
244
-
245
-
246
-
247
-
248
-
249
-
250
-
251
-
252
-
253
-
254
-
255
-
256
-
257
-
258
-
259
-
260
-
261
-
262
-
263
-
264
-
265
-
266
-
267
-
268
-
269
-
270
-
271
-
272
-
273
-
274
-
275
-
276
-
277
-
278
-
279
-
280
-
281
-
282
-
283
-
284
-
285
-
286
-
287
-
288
-
289
-
290
-
291
-
292
-
293
-
294
-
295
-
296
-
297
-
298
-
299
-
300
-
301
-
302
-
303
-
304
-
305
-
306
-
307
-
308
-
309
-
310
-
311
-
312
-
313
-
314
-
315
-
316
-
317
-
318
-
319
-
320
-
321
-
322
-
323
-
324
-
325
-
326
-
327
-
328
-
329
-
330
-
331
-
332
-
333
-
334
-
335
-
336
-
337
-
338
-
339
-
340
-
341
-
342
-
343
-
344
-
345
-
346
-
347
-
348
-
349
-
350
-
351
-
352
-
353
-
354
-
355
-
356
-
357
-
358
-
359
-
360
-
361
-
362
-
363
-
364
-
365
-
366
 |
 |
59
Report on
Operations
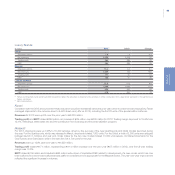
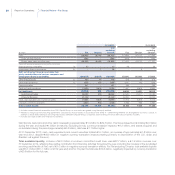
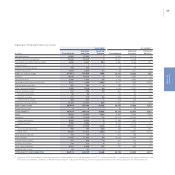
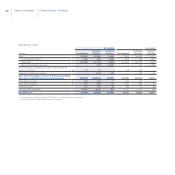
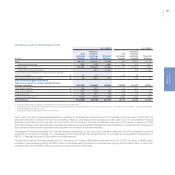
Statement of Financial Position by Activity
31.12.2013 31.12.2012(*)
(€ million) Consolidated
Industrial
Activities
Financial
Services Consolidated
Industrial
Activities
Financial
Services
Intangible assets 19,509 19,502 7 19,284 19,279 5
Property, plant and equipment 22,843 22,840 3 22,061 22,058 3
Investments and other financial assets 2,260 2,657 863 2,287 2,756 787
Leased assets 1 1 - 1 1 -
Defined benefit plan assets 105 105 - 93 93 -
Deferred tax assets 2,893 2,826 67 1,738 1,677 61
Total non-current assets 47,611 47,931 940 45,464 45,864 856
Inventory 10,230 10,222 8 9,295 9,290 5
Trade receivables 2,406 2,394 24 2,702 2,690 20
Receivables from financing activities 3,671 1,580 3,685 3,727 1,600 3,643
Current taxes receivable 291 289 6 236 237 6
Other current receivables 2,302 2,248 56 2,163 2,131 32
Current financial assets: 815 788 29 807 724 83
Current investments 35 35 - 32 32 -
Current securities 247 219 28 256 173 83
Other financial assets 533 534 1 519 519 -
Cash and cash equivalents 19,439 19,239 200 17,657 17,411 246
Total current assets 39,154 36,760 4,008 36,587 34,083 4,035
Assets held for sale 9 9 - 55 55 -
TOTAL ASSETS 86,774 84,700 4,948 82,106 80,002 4,891
Equity 12,584 12,584 1,264 8,369 8,369 1,256
Provisions: 17,360 17,345 15 20,276 20,254 22
Employee benefits 8,265 8,259 6 11,486 11,481 5
Other provisions 9,095 9,086 9 8,790 8,773 17
Debt: 29,902 27,998 3,498 27,889 25,933 3,472
Asset-backed financing 596 156 440 449 52 397
Other debt 29,306 27,842 3,058 27,440 25,881 3,075
Other financial liabilities 137 135 4 201 198 3
Trade payables 17,235 17,225 20 16,558 16,546 20
Current taxes payable 314 300 19 231 223 15
Deferred tax liabilities 278 272 6 801 795 6
Other current liabilities 8,943 8,820 122 7,781 7,684 97
Liabilities held for sale 21 21 - - - -
TOTAL EQUITY AND LIABILITIES 86,774 84,700 4,948 82,106 80,002 4,891
(*) Figures for 2012 Annual Report have been restated to reflect application of the amendment to IAS 19 – Employee Benefits. Compared with the figures published in the
2012 financial statements, there was a €4,804 million reduction in equity for the Group and for Industrial Activities and a €2 million reduction for Financial Services.