Chrysler 2013 Annual Report Download - page 213
Download and view the complete annual report
Please find page 213 of the 2013 Chrysler annual report below. You can navigate through the pages in the report by either clicking on the pages listed below, or by using the keyword search tool below to find specific information within the annual report.-
 1
1 -
2
-
3
-
4
-
5
-
6
-
7
-
8
-
9
-
10
-
11
-
12
-
13
-
14
-
15
-
16
-
17
-
18
-
19
-
20
-
21
-
22
-
23
-
24
-
25
-
26
-
27
-
28
-
29
-
30
-
31
-
32
-
33
-
34
-
35
-
36
-
37
-
38
-
39
-
40
-
41
-
42
-
43
-
44
-
45
-
46
-
47
-
48
-
49
-
50
-
51
-
52
-
53
-
54
-
55
-
56
-
57
-
58
-
59
-
60
-
61
-
62
-
63
-
64
-
65
-
66
-
67
-
68
-
69
-
70
-
71
-
72
-
73
-
74
-
75
-
76
-
77
-
78
-
79
-
80
-
81
-
82
-
83
-
84
-
85
-
86
-
87
-
88
-
89
-
90
-
91
-
92
-
93
-
94
-
95
-
96
-
97
-
98
-
99
-
100
-
101
-
102
-
103
-
104
-
105
-
106
-
107
-
108
-
109
-
110
-
111
-
112
-
113
-
114
-
115
-
116
-
117
-
118
-
119
-
120
-
121
-
122
-
123
-
124
-
125
-
126
-
127
-
128
-
129
-
130
-
131
-
132
-
133
-
134
-
135
-
136
-
137
-
138
-
139
-
140
-
141
-
142
-
143
-
144
-
145
-
146
-
147
-
148
-
149
-
150
-
151
-
152
-
153
-
154
-
155
-
156
-
157
-
158
-
159
-
160
-
161
-
162
-
163
-
164
-
165
-
166
-
167
-
168
-
169
-
170
-
171
-
172
-
173
-
174
-
175
-
176
-
177
-
178
-
179
-
180
-
181
-
182
-
183
-
184
-
185
-
186
-
187
-
188
-
189
-
190
-
191
-
192
-
193
-
194
-
195
-
196
-
197
-
198
-
199
-
200
-
201
-
202
-
 203
203 -
 204
204 -
 205
205 -
 206
206 -
 207
207 -
 208
208 -
 209
209 -
 210
210 -
 211
211 -
 212
212 -
 213
213 -
 214
214 -
 215
215 -
 216
216 -
 217
217 -
 218
218 -
 219
219 -
 220
220 -
 221
221 -
 222
222 -
 223
223 -
224
-
225
-
226
-
227
-
228
-
229
-
230
-
231
-
232
-
233
-
234
-
235
-
236
-
237
-
238
-
239
-
240
-
241
-
242
-
243
-
244
-
245
-
246
-
247
-
248
-
249
-
250
-
251
-
252
-
253
-
254
-
255
-
256
-
257
-
258
-
259
-
260
-
261
-
262
-
263
-
264
-
265
-
266
-
267
-
268
-
269
-
270
-
271
-
272
-
273
-
274
-
275
-
276
-
277
-
278
-
279
-
280
-
281
-
282
-
283
-
284
-
285
-
286
-
287
-
288
-
289
-
290
-
291
-
292
-
293
-
294
-
295
-
296
-
297
-
298
-
299
-
300
-
301
-
302
-
303
-
304
-
305
-
306
-
307
-
308
-
309
-
310
-
311
-
312
-
313
-
314
-
315
-
316
-
317
-
318
-
319
-
320
-
321
-
322
-
323
-
324
-
325
-
326
-
327
-
328
-
329
-
330
-
331
-
332
-
333
-
334
-
335
-
336
-
337
-
338
-
339
-
340
-
341
-
342
-
343
-
344
-
345
-
346
-
347
-
348
-
349
-
350
-
351
-
352
-
353
-
354
-
355
-
356
-
357
-
358
-
359
-
360
-
361
-
362
-
363
-
364
-
365
-
366
 |
 |
212 Consolidated
Financial Statements
at 31 December 2013
Notes
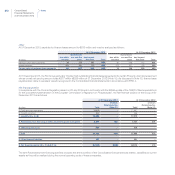
Other
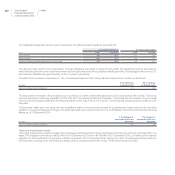
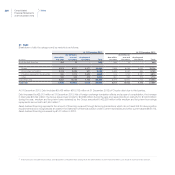
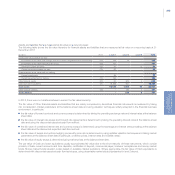
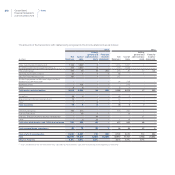
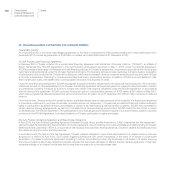
At 31 December 2013, payables for finance leases amount to €535 million and may be analyzed as follows:
At 31 December 2013 At 31 December 2012
(€ million)
due within
one year
due between
one and five
years
due beyond
five years Total
due within
one year
due between
one and five
years
due beyond
five years Total
Minimum future lease payments 80 279 261 620 90 246 215 551
Interest expense (20) (52) (13) (85) (20) (57) (15) (92)
Present value of minimum lease payments 60 227 248 535 70 189 200 459
At 31 December 2013, the Fiat Group excluding Chrysler had outstanding financial lease agreements for certain Property, plant and equipment
whose overall net carrying amount totals €377 million (€268 million at 31 December 2012) (Note 15). As discussed in Note 15, finance lease
payables also relate to suppliers’ assets recognized in the Consolidated financial statements in accordance with IFRIC 4.
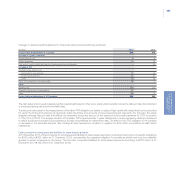
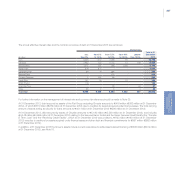
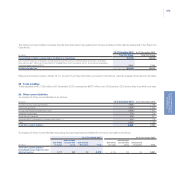
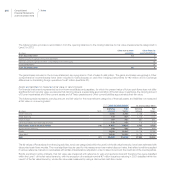
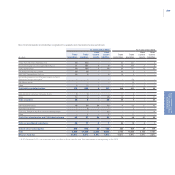
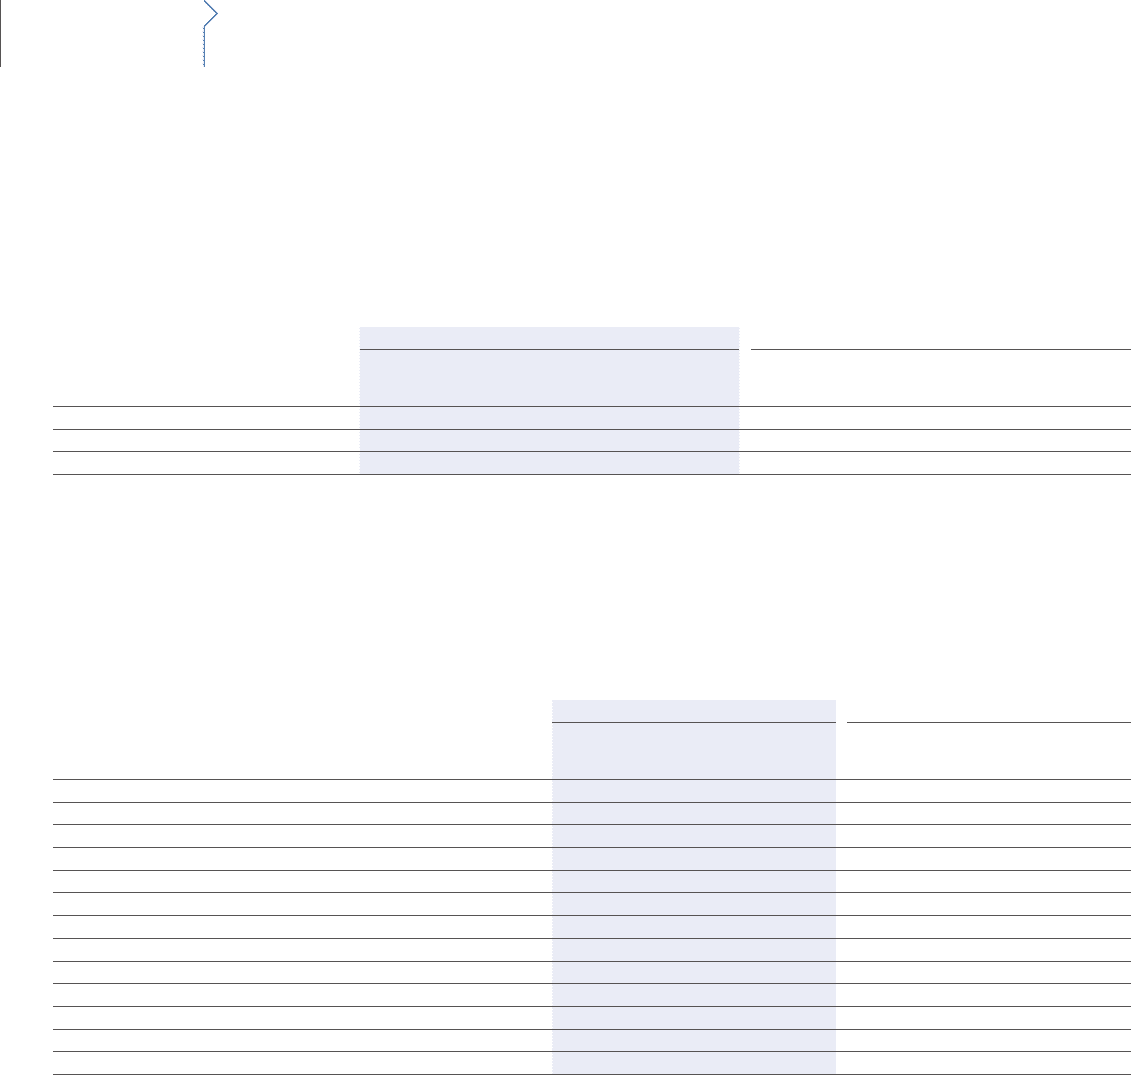
Net financial position
In compliance with the Consob Regulation issued on 28 July 2006 and in conformity with the ESMA update of the CESR’s “Recommendations
for the consistent implementation of the European Commission’s Regulation on Prospectuses”, the Net financial position of the Group at 31
December 2013 is as follows
At 31 December 2013 At 31 December 2012
(€ million) Total
of which
Related parties
(Note 31) Total
of which
Related parties
(Note 31)
A. Cash and cash equivalents 19,439 - 17,657 -
B. Current securities 247 - 256 -
C. Liquidity (C) = (A+B) 19,686 - 17,913 -
D. Receivables from financing activities (Current financial receivables) 3,671 163 3,727 201
E. Other financial assets 533 - 519 -
F. Debt 29,902 448 27,889 272
G. Other financial liabilities 137 - 201 -
H. Net financial position (H) = (C+D+E-F-G) (6,149) (285) (5,931) (71)
The item Receivables from financing activities includes the entire portfolio of the Consolidated financial services entities, classified as current
assets as they will be realized during the normal operating cycle of these companies.