Chrysler 2013 Annual Report Download - page 181
Download and view the complete annual report
Please find page 181 of the 2013 Chrysler annual report below. You can navigate through the pages in the report by either clicking on the pages listed below, or by using the keyword search tool below to find specific information within the annual report.-
 1
1 -
2
-
3
-
4
-
5
-
6
-
7
-
8
-
9
-
10
-
11
-
12
-
13
-
14
-
15
-
16
-
17
-
18
-
19
-
20
-
21
-
22
-
23
-
24
-
25
-
26
-
27
-
28
-
29
-
30
-
31
-
32
-
33
-
34
-
35
-
36
-
37
-
38
-
39
-
40
-
41
-
42
-
43
-
44
-
45
-
46
-
47
-
48
-
49
-
50
-
51
-
52
-
53
-
54
-
55
-
56
-
57
-
58
-
59
-
60
-
61
-
62
-
63
-
64
-
65
-
66
-
67
-
68
-
69
-
70
-
71
-
72
-
73
-
74
-
75
-
76
-
77
-
78
-
79
-
80
-
81
-
82
-
83
-
84
-
85
-
86
-
87
-
88
-
89
-
90
-
91
-
92
-
93
-
94
-
95
-
96
-
97
-
98
-
99
-
100
-
101
-
102
-
103
-
104
-
105
-
106
-
107
-
108
-
109
-
110
-
111
-
112
-
113
-
114
-
115
-
116
-
117
-
118
-
119
-
120
-
121
-
122
-
123
-
124
-
125
-
126
-
127
-
128
-
129
-
130
-
131
-
132
-
133
-
134
-
135
-
136
-
137
-
138
-
139
-
140
-
141
-
142
-
143
-
144
-
145
-
146
-
147
-
148
-
149
-
150
-
151
-
152
-
153
-
154
-
155
-
156
-
157
-
158
-
159
-
160
-
161
-
162
-
163
-
164
-
165
-
166
-
167
-
168
-
169
-
170
-
 171
171 -
 172
172 -
 173
173 -
 174
174 -
 175
175 -
 176
176 -
 177
177 -
 178
178 -
 179
179 -
 180
180 -
 181
181 -
 182
182 -
 183
183 -
 184
184 -
 185
185 -
 186
186 -
 187
187 -
 188
188 -
 189
189 -
 190
190 -
 191
191 -
192
-
193
-
194
-
195
-
196
-
197
-
198
-
199
-
200
-
201
-
202
-
203
-
204
-
205
-
206
-
207
-
208
-
209
-
210
-
211
-
212
-
213
-
214
-
215
-
216
-
217
-
218
-
219
-
220
-
221
-
222
-
223
-
224
-
225
-
226
-
227
-
228
-
229
-
230
-
231
-
232
-
233
-
234
-
235
-
236
-
237
-
238
-
239
-
240
-
241
-
242
-
243
-
244
-
245
-
246
-
247
-
248
-
249
-
250
-
251
-
252
-
253
-
254
-
255
-
256
-
257
-
258
-
259
-
260
-
261
-
262
-
263
-
264
-
265
-
266
-
267
-
268
-
269
-
270
-
271
-
272
-
273
-
274
-
275
-
276
-
277
-
278
-
279
-
280
-
281
-
282
-
283
-
284
-
285
-
286
-
287
-
288
-
289
-
290
-
291
-
292
-
293
-
294
-
295
-
296
-
297
-
298
-
299
-
300
-
301
-
302
-
303
-
304
-
305
-
306
-
307
-
308
-
309
-
310
-
311
-
312
-
313
-
314
-
315
-
316
-
317
-
318
-
319
-
320
-
321
-
322
-
323
-
324
-
325
-
326
-
327
-
328
-
329
-
330
-
331
-
332
-
333
-
334
-
335
-
336
-
337
-
338
-
339
-
340
-
341
-
342
-
343
-
344
-
345
-
346
-
347
-
348
-
349
-
350
-
351
-
352
-
353
-
354
-
355
-
356
-
357
-
358
-
359
-
360
-
361
-
362
-
363
-
364
-
365
-
366
 |
 |

180 Consolidated
Financial Statements
at 31 December 2013
Notes
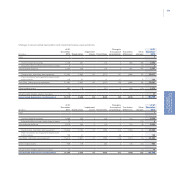
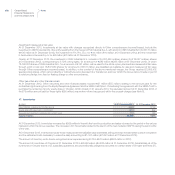
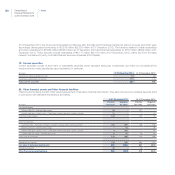
At 31 December 2013, the Group had receivables and bills due after that date which had been transferred without recourse and which were
accordingly derecognized amounting to €3,576 million (€3,631 million at 31 December 2012). The transfers related to trade receivables
and other receivables for €2,864 million (€2,932 million at 31 December 2012) and financial receivables for €712 million (€699 million at 31
December 2012). These amounts include receivables of €2,177 million (€2,179 million at 31 December 2012), mainly due from the sales
network, transferred to jointly controlled financial services companies (FGA Capital).
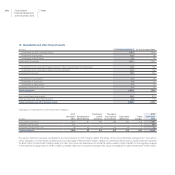
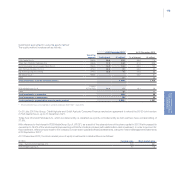
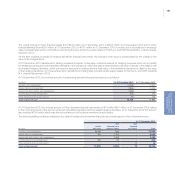
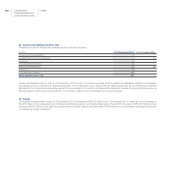
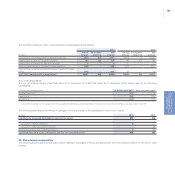
19. Current securities
Current securities consist of short-term or marketable securities which represent temporary investments, but which do not satisfy all the
requirements for being classified as cash equivalents. In particular:
(€ million) At 31 December 2013 At 31 December 2012
Current securities available-for-sale 92 83
Current securities held-for-trading 155 173
Total Current securities 247 256
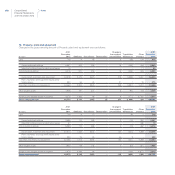
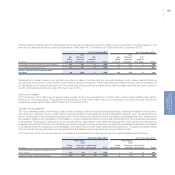
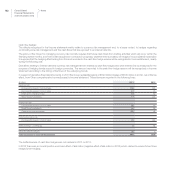
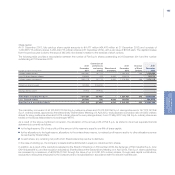
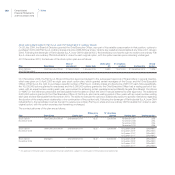
20. Other financial assets and Other financial liabilities
These line items mainly consist of fair value measurement of derivative financial instruments. They also include some collateral deposits (held
in connection with derivative transactions and debts).
At 31 December 2013 At 31 December 2012
(€ million)
Positive
fair value
Negative
fair value
Positive
fair value
Negative
fair value
Fair value hedges
Interest rate risk - Interest rate swaps 93 - 121 -
Interest rate and currency risk - Combined interest rate and currency swaps 15 - 1 (1)
Total Fair value hedges 108 - 122 (1)
Cash flow hedges
Currency risks - Forward contracts, Currency swaps and Currency options 260 (59) 108 (75)
Interest rate risk - Interest rate swaps 1 (3) - (8)
Interest rate and currency risk - Combined interest rate and currency swaps 9 (22) 7 (9)
Commodity price risk – Commodity swap 6 (5) 10 (6)
Total Cash flow hedges 276 (89) 125 (98)
Derivatives for trading 129 (48) 254 (102)
Fair value of derivative instruments 513 (137) 501 (201)
Collateral deposits 20 - 18 -
Other financial assets/(liabilities) 533 (137) 519 (201)