Chrysler 2013 Annual Report Download - page 54
Download and view the complete annual report
Please find page 54 of the 2013 Chrysler annual report below. You can navigate through the pages in the report by either clicking on the pages listed below, or by using the keyword search tool below to find specific information within the annual report.-
 1
1 -
2
-
3
-
4
-
5
-
6
-
7
-
8
-
9
-
10
-
11
-
12
-
13
-
14
-
15
-
16
-
17
-
18
-
19
-
20
-
21
-
22
-
23
-
24
-
25
-
26
-
27
-
28
-
29
-
30
-
31
-
32
-
33
-
34
-
35
-
36
-
37
-
38
-
39
-
40
-
41
-
42
-
43
-
 44
44 -
 45
45 -
 46
46 -
 47
47 -
 48
48 -
 49
49 -
 50
50 -
 51
51 -
 52
52 -
 53
53 -
 54
54 -
 55
55 -
 56
56 -
 57
57 -
 58
58 -
 59
59 -
 60
60 -
 61
61 -
 62
62 -
 63
63 -
 64
64 -
65
-
66
-
67
-
68
-
69
-
70
-
71
-
72
-
73
-
74
-
75
-
76
-
77
-
78
-
79
-
80
-
81
-
82
-
83
-
84
-
85
-
86
-
87
-
88
-
89
-
90
-
91
-
92
-
93
-
94
-
95
-
96
-
97
-
98
-
99
-
100
-
101
-
102
-
103
-
104
-
105
-
106
-
107
-
108
-
109
-
110
-
111
-
112
-
113
-
114
-
115
-
116
-
117
-
118
-
119
-
120
-
121
-
122
-
123
-
124
-
125
-
126
-
127
-
128
-
129
-
130
-
131
-
132
-
133
-
134
-
135
-
136
-
137
-
138
-
139
-
140
-
141
-
142
-
143
-
144
-
145
-
146
-
147
-
148
-
149
-
150
-
151
-
152
-
153
-
154
-
155
-
156
-
157
-
158
-
159
-
160
-
161
-
162
-
163
-
164
-
165
-
166
-
167
-
168
-
169
-
170
-
171
-
172
-
173
-
174
-
175
-
176
-
177
-
178
-
179
-
180
-
181
-
182
-
183
-
184
-
185
-
186
-
187
-
188
-
189
-
190
-
191
-
192
-
193
-
194
-
195
-
196
-
197
-
198
-
199
-
200
-
201
-
202
-
203
-
204
-
205
-
206
-
207
-
208
-
209
-
210
-
211
-
212
-
213
-
214
-
215
-
216
-
217
-
218
-
219
-
220
-
221
-
222
-
223
-
224
-
225
-
226
-
227
-
228
-
229
-
230
-
231
-
232
-
233
-
234
-
235
-
236
-
237
-
238
-
239
-
240
-
241
-
242
-
243
-
244
-
245
-
246
-
247
-
248
-
249
-
250
-
251
-
252
-
253
-
254
-
255
-
256
-
257
-
258
-
259
-
260
-
261
-
262
-
263
-
264
-
265
-
266
-
267
-
268
-
269
-
270
-
271
-
272
-
273
-
274
-
275
-
276
-
277
-
278
-
279
-
280
-
281
-
282
-
283
-
284
-
285
-
286
-
287
-
288
-
289
-
290
-
291
-
292
-
293
-
294
-
295
-
296
-
297
-
298
-
299
-
300
-
301
-
302
-
303
-
304
-
305
-
306
-
307
-
308
-
309
-
310
-
311
-
312
-
313
-
314
-
315
-
316
-
317
-
318
-
319
-
320
-
321
-
322
-
323
-
324
-
325
-
326
-
327
-
328
-
329
-
330
-
331
-
332
-
333
-
334
-
335
-
336
-
337
-
338
-
339
-
340
-
341
-
342
-
343
-
344
-
345
-
346
-
347
-
348
-
349
-
350
-
351
-
352
-
353
-
354
-
355
-
356
-
357
-
358
-
359
-
360
-
361
-
362
-
363
-
364
-
365
-
366
 |
 |

53
Report on
Operations
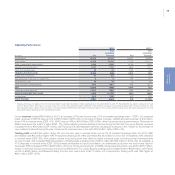
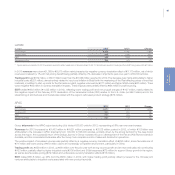
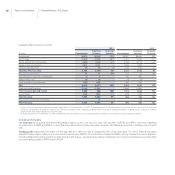
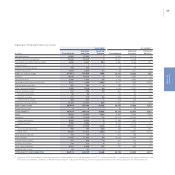
Excluding currency translation effects and changes in the scope of consolidation:
inventories (net of vehicles sold under buy-back commitments) increased by approximately €1 billion, mainly in relation to higher activity
levels for NAFTA, APAC and Luxury Brands
trade receivables decreased by approximately €0.2 billion, which includes payment of amounts receivable from the Indian JV and volume
contractions in EMEA and LATAM
trade payables increased €1.4 billion, mainly due to an increase in production levels in NAFTA and for the Luxury Brands
other current receivables/(payables) was approximately €0.8 billion lower, mainly due to increases in accrued expenses and deferred
income, as well as indirect taxes payable.
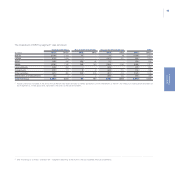
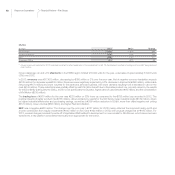
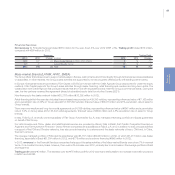
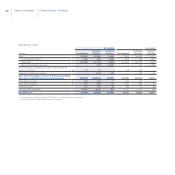
At 31 December 2013, trade receivables, other receivables and receivables from financing activities maturing after that date and sold without
recourse – and, therefore, eliminated from the statement of financial position pursuant to the derecognition requirements of IAS 39 – Financial
Instruments: Recognition and Measurement – totaled €3,576 million (€3,631 million at 31 December 2012). That amount includes €2,177 million
in receivables (€2,179 million at 31 December 2012), primarily financing to the dealer network, that were sold to jointly-controlled financial services
companies (FGA Capital Group).
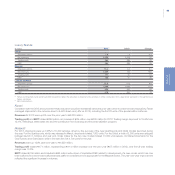
At 31 December 2013, consolidated net debt(1) totaled €9,793 million, an increase of €193 million over year-end 2012. For Fiat excluding
Chrysler, net debt was €10,008 million, €1,905 million higher than 2012 year-end. Capital expenditure for the year (€3.9 billion), an increase
in the financial services portfolio (€0.5 billion), equity investments and a change in the scope of operations (€0.4 billion) were only partially
compensated for by income-related cash inflows (€2.4 billion) and positive currency translation differences (€0.4 billion).
Chrysler reported a net cash position of €215 million, compared with net debt of €1.5 billion at year-end 2012, with €5.2 billion in operating
cash flow more than offsetting €3.6 billion in capital expenditure.
(1) See “Key Performance Indicators” for a description of this measure.