Chrysler 2013 Annual Report Download - page 100
Download and view the complete annual report
Please find page 100 of the 2013 Chrysler annual report below. You can navigate through the pages in the report by either clicking on the pages listed below, or by using the keyword search tool below to find specific information within the annual report.-
 1
1 -
2
-
3
-
4
-
5
-
6
-
7
-
8
-
9
-
10
-
11
-
12
-
13
-
14
-
15
-
16
-
17
-
18
-
19
-
20
-
21
-
22
-
23
-
24
-
25
-
26
-
27
-
28
-
29
-
30
-
31
-
32
-
33
-
34
-
35
-
36
-
37
-
38
-
39
-
40
-
41
-
42
-
43
-
44
-
45
-
46
-
47
-
48
-
49
-
50
-
51
-
52
-
53
-
54
-
55
-
56
-
57
-
58
-
59
-
60
-
61
-
62
-
63
-
64
-
65
-
66
-
67
-
68
-
69
-
70
-
71
-
72
-
73
-
74
-
75
-
76
-
77
-
78
-
79
-
80
-
81
-
82
-
83
-
84
-
85
-
86
-
87
-
88
-
89
-
 90
90 -
 91
91 -
 92
92 -
 93
93 -
 94
94 -
 95
95 -
 96
96 -
 97
97 -
 98
98 -
 99
99 -
 100
100 -
 101
101 -
 102
102 -
 103
103 -
 104
104 -
 105
105 -
 106
106 -
 107
107 -
 108
108 -
 109
109 -
 110
110 -
111
-
112
-
113
-
114
-
115
-
116
-
117
-
118
-
119
-
120
-
121
-
122
-
123
-
124
-
125
-
126
-
127
-
128
-
129
-
130
-
131
-
132
-
133
-
134
-
135
-
136
-
137
-
138
-
139
-
140
-
141
-
142
-
143
-
144
-
145
-
146
-
147
-
148
-
149
-
150
-
151
-
152
-
153
-
154
-
155
-
156
-
157
-
158
-
159
-
160
-
161
-
162
-
163
-
164
-
165
-
166
-
167
-
168
-
169
-
170
-
171
-
172
-
173
-
174
-
175
-
176
-
177
-
178
-
179
-
180
-
181
-
182
-
183
-
184
-
185
-
186
-
187
-
188
-
189
-
190
-
191
-
192
-
193
-
194
-
195
-
196
-
197
-
198
-
199
-
200
-
201
-
202
-
203
-
204
-
205
-
206
-
207
-
208
-
209
-
210
-
211
-
212
-
213
-
214
-
215
-
216
-
217
-
218
-
219
-
220
-
221
-
222
-
223
-
224
-
225
-
226
-
227
-
228
-
229
-
230
-
231
-
232
-
233
-
234
-
235
-
236
-
237
-
238
-
239
-
240
-
241
-
242
-
243
-
244
-
245
-
246
-
247
-
248
-
249
-
250
-
251
-
252
-
253
-
254
-
255
-
256
-
257
-
258
-
259
-
260
-
261
-
262
-
263
-
264
-
265
-
266
-
267
-
268
-
269
-
270
-
271
-
272
-
273
-
274
-
275
-
276
-
277
-
278
-
279
-
280
-
281
-
282
-
283
-
284
-
285
-
286
-
287
-
288
-
289
-
290
-
291
-
292
-
293
-
294
-
295
-
296
-
297
-
298
-
299
-
300
-
301
-
302
-
303
-
304
-
305
-
306
-
307
-
308
-
309
-
310
-
311
-
312
-
313
-
314
-
315
-
316
-
317
-
318
-
319
-
320
-
321
-
322
-
323
-
324
-
325
-
326
-
327
-
328
-
329
-
330
-
331
-
332
-
333
-
334
-
335
-
336
-
337
-
338
-
339
-
340
-
341
-
342
-
343
-
344
-
345
-
346
-
347
-
348
-
349
-
350
-
351
-
352
-
353
-
354
-
355
-
356
-
357
-
358
-
359
-
360
-
361
-
362
-
363
-
364
-
365
-
366
 |
 |

99
Report on
Operations
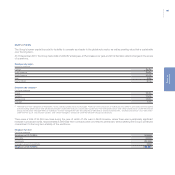
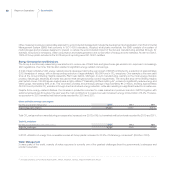
To protect this essential natural resource, the Group has adopted Water Management Guidelines that establish criteria for sustainable
management of the entire water cycle, including technologies and procedures to maximize recycling and reuse of water and minimize the level
of pollutants existing in discharged water.
In 2013, the level of water reuse in the manufacturing cycle at Group plants worldwide was 98.8%, representing a total of more than 2.1 billion m3
in water savings.
As a result, water withdrawal was reduced by 3.6% over 2012 maintaining the trend of continuous reductions (-27.1% versus 2010)(1). Lower
water consumption at plants worldwide generated total savings of approximately €2.5 million.
Water withdrawal
Fiat Group worldwide (thousands of m3)2013 2012 2011
Total water withdrawal 24,936 25,874 29,862
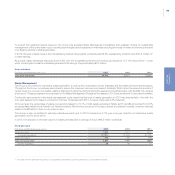
Waste Management
Fiat Group is committed to preventing waste generation to reduce the consumption of raw materials and the related environmental impacts.
Throughout the Group, procedures are in place to ensure the maximum recovery and reuse of materials. What cannot be reused is recycled. If
neither reuse nor recovery is possible, waste is disposed of using the method having the least environmental impact, with landfills only used as
a last resort. These principles are incorporated in the Waste Management Guidelines formalized in 2012 and adopted at Group sites worldwide.
Continued improvements in the waste management cycle meant that the level of waste generation in 2013 was substantially in line with the
prior year despite the increase in production volumes. Compared with 2011, however, there was 2.5% reduction.
At Group level, the percentage of waste recovered increased to 72.7% of total waste generated. Waste sent to landfill accounted for 24.3%
and essentially related to inert sand from Teksid foundries. Plants which produce for the mass-market and premium brands, however, reduced
waste to landfill either to zero or very close to zero.
The Group is also committed to reducing hazardous waste and in 2013 it achieved a 3.1% year-over-year reduction in hazardous waste
generated (-36.7% since 2010).
In 2013, the reduction in the total volume of waste generated led to savings of around €4.5 million worldwide.
Waste generated
Fiat Group worldwide (thousands of tons) 2013 2012 2011
Waste recovered 1,316 1,271 1,247
% of waste recovered 72.72% 72.20% 67.24%
Waste disposed of 493 490 608
Total waste generated 1,809 1,761 1,855
of which hazardous 39 40 51
(1) First year in which Chrysler Group was consolidated and therefore scope of operations is comparable with 2013.