Chrysler 2013 Annual Report Download - page 171
Download and view the complete annual report
Please find page 171 of the 2013 Chrysler annual report below. You can navigate through the pages in the report by either clicking on the pages listed below, or by using the keyword search tool below to find specific information within the annual report.-
 1
1 -
2
-
3
-
4
-
5
-
6
-
7
-
8
-
9
-
10
-
11
-
12
-
13
-
14
-
15
-
16
-
17
-
18
-
19
-
20
-
21
-
22
-
23
-
24
-
25
-
26
-
27
-
28
-
29
-
30
-
31
-
32
-
33
-
34
-
35
-
36
-
37
-
38
-
39
-
40
-
41
-
42
-
43
-
44
-
45
-
46
-
47
-
48
-
49
-
50
-
51
-
52
-
53
-
54
-
55
-
56
-
57
-
58
-
59
-
60
-
61
-
62
-
63
-
64
-
65
-
66
-
67
-
68
-
69
-
70
-
71
-
72
-
73
-
74
-
75
-
76
-
77
-
78
-
79
-
80
-
81
-
82
-
83
-
84
-
85
-
86
-
87
-
88
-
89
-
90
-
91
-
92
-
93
-
94
-
95
-
96
-
97
-
98
-
99
-
100
-
101
-
102
-
103
-
104
-
105
-
106
-
107
-
108
-
109
-
110
-
111
-
112
-
113
-
114
-
115
-
116
-
117
-
118
-
119
-
120
-
121
-
122
-
123
-
124
-
125
-
126
-
127
-
128
-
129
-
130
-
131
-
132
-
133
-
134
-
135
-
136
-
137
-
138
-
139
-
140
-
141
-
142
-
143
-
144
-
145
-
146
-
147
-
148
-
149
-
150
-
151
-
152
-
153
-
154
-
155
-
156
-
157
-
158
-
159
-
160
-
 161
161 -
 162
162 -
 163
163 -
 164
164 -
 165
165 -
 166
166 -
 167
167 -
 168
168 -
 169
169 -
 170
170 -
 171
171 -
 172
172 -
 173
173 -
 174
174 -
 175
175 -
 176
176 -
 177
177 -
 178
178 -
 179
179 -
 180
180 -
 181
181 -
182
-
183
-
184
-
185
-
186
-
187
-
188
-
189
-
190
-
191
-
192
-
193
-
194
-
195
-
196
-
197
-
198
-
199
-
200
-
201
-
202
-
203
-
204
-
205
-
206
-
207
-
208
-
209
-
210
-
211
-
212
-
213
-
214
-
215
-
216
-
217
-
218
-
219
-
220
-
221
-
222
-
223
-
224
-
225
-
226
-
227
-
228
-
229
-
230
-
231
-
232
-
233
-
234
-
235
-
236
-
237
-
238
-
239
-
240
-
241
-
242
-
243
-
244
-
245
-
246
-
247
-
248
-
249
-
250
-
251
-
252
-
253
-
254
-
255
-
256
-
257
-
258
-
259
-
260
-
261
-
262
-
263
-
264
-
265
-
266
-
267
-
268
-
269
-
270
-
271
-
272
-
273
-
274
-
275
-
276
-
277
-
278
-
279
-
280
-
281
-
282
-
283
-
284
-
285
-
286
-
287
-
288
-
289
-
290
-
291
-
292
-
293
-
294
-
295
-
296
-
297
-
298
-
299
-
300
-
301
-
302
-
303
-
304
-
305
-
306
-
307
-
308
-
309
-
310
-
311
-
312
-
313
-
314
-
315
-
316
-
317
-
318
-
319
-
320
-
321
-
322
-
323
-
324
-
325
-
326
-
327
-
328
-
329
-
330
-
331
-
332
-
333
-
334
-
335
-
336
-
337
-
338
-
339
-
340
-
341
-
342
-
343
-
344
-
345
-
346
-
347
-
348
-
349
-
350
-
351
-
352
-
353
-
354
-
355
-
356
-
357
-
358
-
359
-
360
-
361
-
362
-
363
-
364
-
365
-
366
 |
 |
170 Consolidated
Financial Statements
at 31 December 2013
Notes
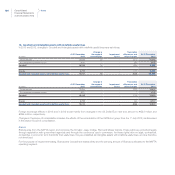
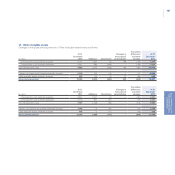
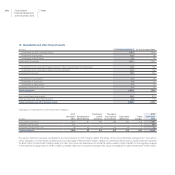
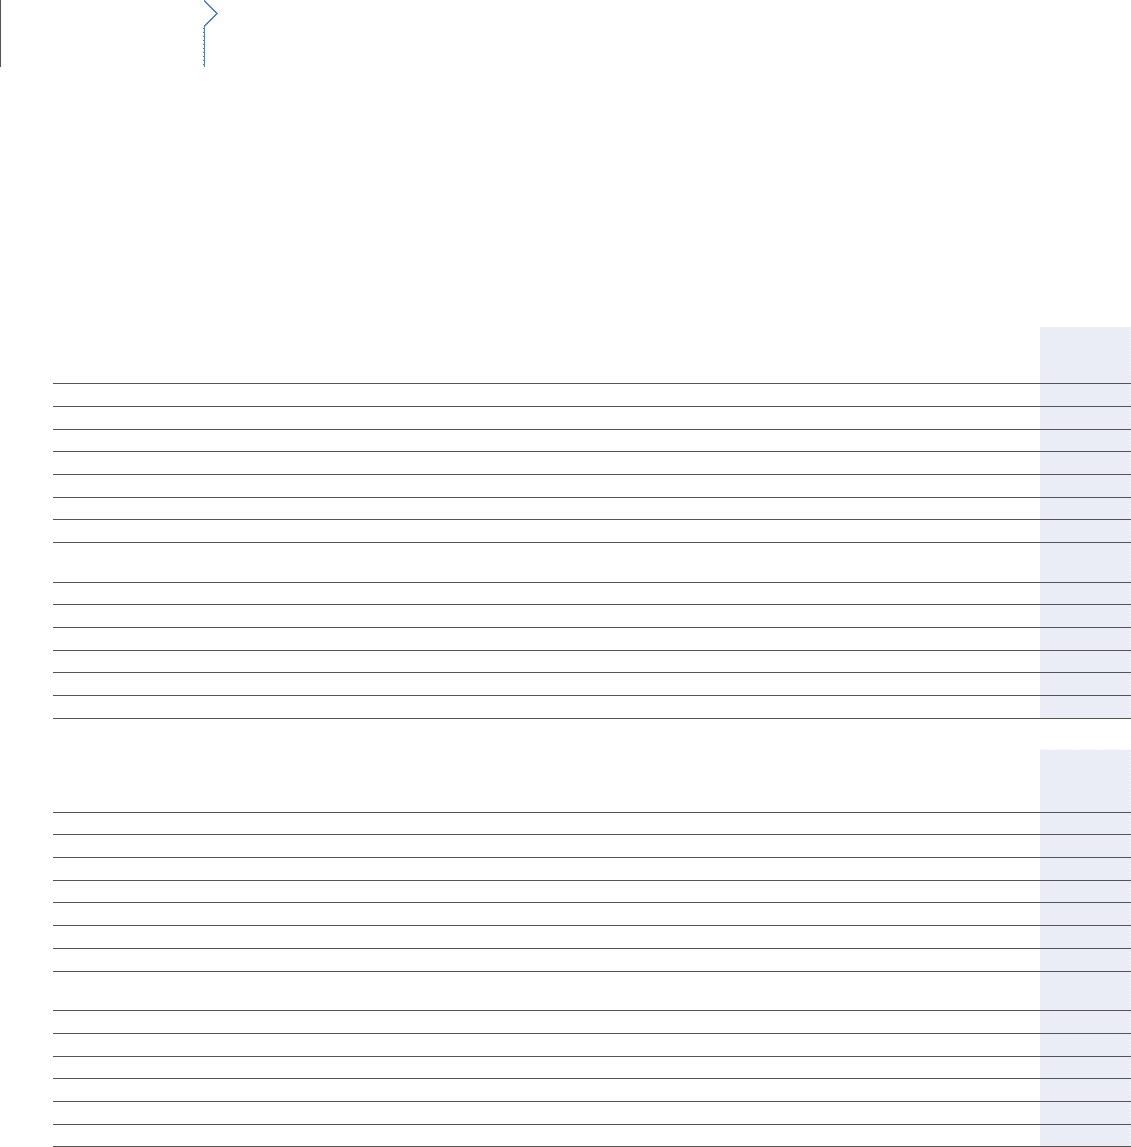
15. Property, plant and equipment
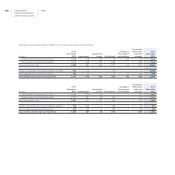
Changes in the gross carrying amount of Property, plant and equipment were as follows:
(€ million)
At 31
December
2012 Additions Divestitures Depreciation
Change in
the scope of
consolidation
Translation
differences
Other
changes
At 31
December
2013
Land 716 4 (5) - 3 (55) 216 879
Owned industrial buildings 6,397 510 (29) - 19 (282) 254 6,869
Industrial buildings leased under finance leases 19 - - - - - 71 90
Total Industrial buildings 6,416 510 (29) - 19 (282) 325 6,959
Owned plant, machinery and equipment 34,078 2,470 (847) - 213 (1,338) 2,357 36,933
Plant, machinery and equipment leased under
finance leases 382 54 (4) - 27 1 15 475
Total Plant, machinery and equipment 34,460 2,524 (851) - 240 (1,337) 2,372 37,408
Other tangible assets 1,908 137 (51) - 5 (93) 123 2,029
Advances and tangible assets in progress 3,273 1,935 (4) (2) 4 (177) (2,752) 2,277
Gross carrying amount 46,773 5,110 (940) (2) 271 (1,944) 284 49,552
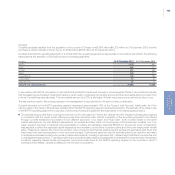
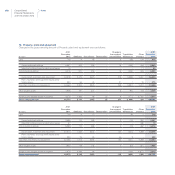
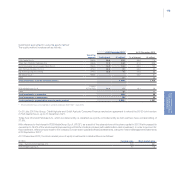
(€ million)
At 31
December
2011 Additions Divestitures Depreciation
Change in
the scope of
consolidation
Translation
differences
Other
changes
At 31
December
2012
Land 726 4 (7) - - (8) 1 716
Owned industrial buildings 5,938 170 (33) - 2 (70) 390 6,397
Industrial buildings leased under finance leases 57 - - - - - (38) 19
Total Industrial buildings 5,995 170 (33) - 2 (70) 352 6,416
Owned plant, machinery and equipment 31,674 1,244 (822) - (12) (404) 2,398 34,078
Plant, machinery and equipment leased under
finance leases 359 29 (3) - (6) 3 - 382
Total Plant, machinery and equipment 32,033 1,273 (825) - (18) (401) 2,398 34,460
Other tangible assets 1,940 118 (75) - 2 (20) (57) 1,908
Advances and tangible assets in progress 2,679 3,584 (9) - - (104) (2,877) 3,273
Gross carrying amount 43,373 5,149 (949) - (14) (603) (183) 46,773