Chrysler 2013 Annual Report Download - page 15
Download and view the complete annual report
Please find page 15 of the 2013 Chrysler annual report below. You can navigate through the pages in the report by either clicking on the pages listed below, or by using the keyword search tool below to find specific information within the annual report.-
 1
1 -
2
-
3
-
4
-
 5
5 -
 6
6 -
 7
7 -
 8
8 -
 9
9 -
 10
10 -
 11
11 -
 12
12 -
 13
13 -
 14
14 -
 15
15 -
 16
16 -
 17
17 -
 18
18 -
 19
19 -
 20
20 -
 21
21 -
 22
22 -
 23
23 -
 24
24 -
 25
25 -
26
-
27
-
28
-
29
-
30
-
31
-
32
-
33
-
34
-
35
-
36
-
37
-
38
-
39
-
40
-
41
-
42
-
43
-
44
-
45
-
46
-
47
-
48
-
49
-
50
-
51
-
52
-
53
-
54
-
55
-
56
-
57
-
58
-
59
-
60
-
61
-
62
-
63
-
64
-
65
-
66
-
67
-
68
-
69
-
70
-
71
-
72
-
73
-
74
-
75
-
76
-
77
-
78
-
79
-
80
-
81
-
82
-
83
-
84
-
85
-
86
-
87
-
88
-
89
-
90
-
91
-
92
-
93
-
94
-
95
-
96
-
97
-
98
-
99
-
100
-
101
-
102
-
103
-
104
-
105
-
106
-
107
-
108
-
109
-
110
-
111
-
112
-
113
-
114
-
115
-
116
-
117
-
118
-
119
-
120
-
121
-
122
-
123
-
124
-
125
-
126
-
127
-
128
-
129
-
130
-
131
-
132
-
133
-
134
-
135
-
136
-
137
-
138
-
139
-
140
-
141
-
142
-
143
-
144
-
145
-
146
-
147
-
148
-
149
-
150
-
151
-
152
-
153
-
154
-
155
-
156
-
157
-
158
-
159
-
160
-
161
-
162
-
163
-
164
-
165
-
166
-
167
-
168
-
169
-
170
-
171
-
172
-
173
-
174
-
175
-
176
-
177
-
178
-
179
-
180
-
181
-
182
-
183
-
184
-
185
-
186
-
187
-
188
-
189
-
190
-
191
-
192
-
193
-
194
-
195
-
196
-
197
-
198
-
199
-
200
-
201
-
202
-
203
-
204
-
205
-
206
-
207
-
208
-
209
-
210
-
211
-
212
-
213
-
214
-
215
-
216
-
217
-
218
-
219
-
220
-
221
-
222
-
223
-
224
-
225
-
226
-
227
-
228
-
229
-
230
-
231
-
232
-
233
-
234
-
235
-
236
-
237
-
238
-
239
-
240
-
241
-
242
-
243
-
244
-
245
-
246
-
247
-
248
-
249
-
250
-
251
-
252
-
253
-
254
-
255
-
256
-
257
-
258
-
259
-
260
-
261
-
262
-
263
-
264
-
265
-
266
-
267
-
268
-
269
-
270
-
271
-
272
-
273
-
274
-
275
-
276
-
277
-
278
-
279
-
280
-
281
-
282
-
283
-
284
-
285
-
286
-
287
-
288
-
289
-
290
-
291
-
292
-
293
-
294
-
295
-
296
-
297
-
298
-
299
-
300
-
301
-
302
-
303
-
304
-
305
-
306
-
307
-
308
-
309
-
310
-
311
-
312
-
313
-
314
-
315
-
316
-
317
-
318
-
319
-
320
-
321
-
322
-
323
-
324
-
325
-
326
-
327
-
328
-
329
-
330
-
331
-
332
-
333
-
334
-
335
-
336
-
337
-
338
-
339
-
340
-
341
-
342
-
343
-
344
-
345
-
346
-
347
-
348
-
349
-
350
-
351
-
352
-
353
-
354
-
355
-
356
-
357
-
358
-
359
-
360
-
361
-
362
-
363
-
364
-
365
-
366
 |
 |

14
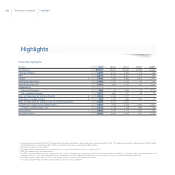
Financial Highlights
(€ million) 2013 2012(1) 2011(2) 2010(3) 2009(3)
Net revenues 86,816 83,957 59,559 35,880 32,684
Trading profit/(loss) 3,394 3,541 2,392 1,112 736
EBIT 2,972 3,404 3,467 1,106 455
EBITDA (4) 7,546 7,538 6,825 3,292 2,491
Profit/(loss) before taxes 1,008 1,519 2,185 706 103
Profit/(loss) for the year 1,951 896 1,651 222 (345)
Attributable to:
Owners of the parent 904 44 1,334 179 (374)
Non-controlling interests 1,047 852 317 43 29
Basic earnings/(loss) per ordinary share (€)(5) 0.744 0.036 1.101 - -
Profit/(loss) excluding unusuals (6) 943 1,140 684 342 13
Basic earnings/(loss) per ordinary share (excluding unusuals) (€)0.099 0.242 0.254 - -
Investments in tangible and intangible assets 7,440 7,534 5,528 2,864 2,684
of which: capitalized R&D costs 2,042 2,138 1,438 886 748
R&D spending (7) 3,362 3,310 2,175 1,284 1,154
Net industrial debt 6,649 6,545 5,529 542 3,103
The Group at a Glance Highlights
Highlights
(1) Figures previously included in the 2012 Annual Report have been restated to reflect application of the amendment to IAS 19. Trading profit and EBIT were reduced by €273 million,
profit before taxes was reduced by €517 million, and profit for the year was reduced by €515 million.
(2) Includes Chrysler from June 2011.
(3) Excludes activities transferred to Fiat Industrial S.p.A. (now CNH Industrial N.V.) on 1 January 2011.
(4) EBIT plus depreciation and amortization.
(5) For 2011, the calculation assumes conversion of all Fiat S.p.A. preference and savings shares into ordinary shares on January 1st. For prior years, comparable data is not
available. Note 12 to the Consolidated Financial Statements provides additional information on the calculation of basic and diluted earnings per share.
(6) Excluding unusual items and, for 2013, also the recognition of one-off net deferred tax assets.
(7) Includes capitalized R&D and R&D charged directly to the income statement.