Chrysler 2013 Annual Report Download - page 16
Download and view the complete annual report
Please find page 16 of the 2013 Chrysler annual report below. You can navigate through the pages in the report by either clicking on the pages listed below, or by using the keyword search tool below to find specific information within the annual report.-
 1
1 -
2
-
3
-
4
-
5
-
 6
6 -
 7
7 -
 8
8 -
 9
9 -
 10
10 -
 11
11 -
 12
12 -
 13
13 -
 14
14 -
 15
15 -
 16
16 -
 17
17 -
 18
18 -
 19
19 -
 20
20 -
 21
21 -
 22
22 -
 23
23 -
 24
24 -
 25
25 -
 26
26 -
27
-
28
-
29
-
30
-
31
-
32
-
33
-
34
-
35
-
36
-
37
-
38
-
39
-
40
-
41
-
42
-
43
-
44
-
45
-
46
-
47
-
48
-
49
-
50
-
51
-
52
-
53
-
54
-
55
-
56
-
57
-
58
-
59
-
60
-
61
-
62
-
63
-
64
-
65
-
66
-
67
-
68
-
69
-
70
-
71
-
72
-
73
-
74
-
75
-
76
-
77
-
78
-
79
-
80
-
81
-
82
-
83
-
84
-
85
-
86
-
87
-
88
-
89
-
90
-
91
-
92
-
93
-
94
-
95
-
96
-
97
-
98
-
99
-
100
-
101
-
102
-
103
-
104
-
105
-
106
-
107
-
108
-
109
-
110
-
111
-
112
-
113
-
114
-
115
-
116
-
117
-
118
-
119
-
120
-
121
-
122
-
123
-
124
-
125
-
126
-
127
-
128
-
129
-
130
-
131
-
132
-
133
-
134
-
135
-
136
-
137
-
138
-
139
-
140
-
141
-
142
-
143
-
144
-
145
-
146
-
147
-
148
-
149
-
150
-
151
-
152
-
153
-
154
-
155
-
156
-
157
-
158
-
159
-
160
-
161
-
162
-
163
-
164
-
165
-
166
-
167
-
168
-
169
-
170
-
171
-
172
-
173
-
174
-
175
-
176
-
177
-
178
-
179
-
180
-
181
-
182
-
183
-
184
-
185
-
186
-
187
-
188
-
189
-
190
-
191
-
192
-
193
-
194
-
195
-
196
-
197
-
198
-
199
-
200
-
201
-
202
-
203
-
204
-
205
-
206
-
207
-
208
-
209
-
210
-
211
-
212
-
213
-
214
-
215
-
216
-
217
-
218
-
219
-
220
-
221
-
222
-
223
-
224
-
225
-
226
-
227
-
228
-
229
-
230
-
231
-
232
-
233
-
234
-
235
-
236
-
237
-
238
-
239
-
240
-
241
-
242
-
243
-
244
-
245
-
246
-
247
-
248
-
249
-
250
-
251
-
252
-
253
-
254
-
255
-
256
-
257
-
258
-
259
-
260
-
261
-
262
-
263
-
264
-
265
-
266
-
267
-
268
-
269
-
270
-
271
-
272
-
273
-
274
-
275
-
276
-
277
-
278
-
279
-
280
-
281
-
282
-
283
-
284
-
285
-
286
-
287
-
288
-
289
-
290
-
291
-
292
-
293
-
294
-
295
-
296
-
297
-
298
-
299
-
300
-
301
-
302
-
303
-
304
-
305
-
306
-
307
-
308
-
309
-
310
-
311
-
312
-
313
-
314
-
315
-
316
-
317
-
318
-
319
-
320
-
321
-
322
-
323
-
324
-
325
-
326
-
327
-
328
-
329
-
330
-
331
-
332
-
333
-
334
-
335
-
336
-
337
-
338
-
339
-
340
-
341
-
342
-
343
-
344
-
345
-
346
-
347
-
348
-
349
-
350
-
351
-
352
-
353
-
354
-
355
-
356
-
357
-
358
-
359
-
360
-
361
-
362
-
363
-
364
-
365
-
366
 |
 |

15
The Group
at a Glance
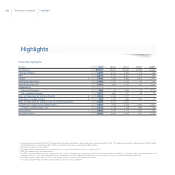
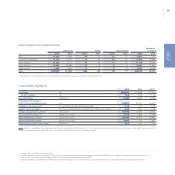
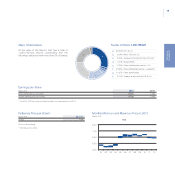
Select Data by Geographical Area
Employees Plants R&D Centers
Revenues(*)
(€ million)
2013 2012 2013 2012 2013 2012 2013 2012
Italy 62,505 61,858 45 44 35 37 6,937 7,275
Europe (excluding Italy) 26,525 26,767 33 33 16 15 13,038 12,999
North America 81,365 73,713 49 48 17 16 47,738 45,348
South America 48,306 46,949 19 19 5510,501 11,805
Other regions 6,886 5,549 13 14 548,602 6,530
Total 225,587 214,836 159 158 78 77 86,816 83,957
(*) Revenues for each geographical area include Mass-Market Brands, Luxury Brands and Components.
Sustainability Highlights
2013 2012 2011(1)
Employees (no.) 225,587 214,836 197,021
of which women (%) 19.6 19.2 17.9
Hours of training (thousand) 4,232 4,206 4,048
Employees participating in
performance evaluation process (2) (no.) 54,500 52,700 39,500
Frequency rate of accidents (no. accidents per 100,000 hours worked) 0.19 0.22 0.28
Severity rate of accidents (no. days of absence due to accidents per 1,000 hours worked) 0.06 0.07 0.08
Energy consumption by plants (3) (TeraJoules) 48,322 45,692 48,875
CO2 emissions by plants (3) (thousands of tons) 4,178 3,965 4,196
Water withdrawal by plants (thousands of m3) 24,936 25,874 29,862
Waste generated by plants (thousands of tons) 1,809 1,761 1,855
Contributions to local communities (4) (€ million) 19.7 20.8 36.5
Note: All data is audited by the independent certification organization SGS Italia S.p.A. The scope, methodology, limitations and conclusions of the audit are provided in the
Assurance Statement issued by SGS and published in the Fiat Group 2013 Sustainability Report.
(1) Includes Chrysler Group for the full year.
(2) Includes all employees participating in the PLM (Performance and Leadership Management) and PBF (Performance & Behavior Feedback) evaluation processes.
(3) Data for 2011 has been recalculated to reflect the scope of reporting applicable for 2012.
(4) Includes initiatives undertaken by the Group worldwide in support of local communities. Calculation based on London Benchmarking Group (LBG) method.