Chrysler 2013 Annual Report Download - page 167
Download and view the complete annual report
Please find page 167 of the 2013 Chrysler annual report below. You can navigate through the pages in the report by either clicking on the pages listed below, or by using the keyword search tool below to find specific information within the annual report.-
 1
1 -
2
-
3
-
4
-
5
-
6
-
7
-
8
-
9
-
10
-
11
-
12
-
13
-
14
-
15
-
16
-
17
-
18
-
19
-
20
-
21
-
22
-
23
-
24
-
25
-
26
-
27
-
28
-
29
-
30
-
31
-
32
-
33
-
34
-
35
-
36
-
37
-
38
-
39
-
40
-
41
-
42
-
43
-
44
-
45
-
46
-
47
-
48
-
49
-
50
-
51
-
52
-
53
-
54
-
55
-
56
-
57
-
58
-
59
-
60
-
61
-
62
-
63
-
64
-
65
-
66
-
67
-
68
-
69
-
70
-
71
-
72
-
73
-
74
-
75
-
76
-
77
-
78
-
79
-
80
-
81
-
82
-
83
-
84
-
85
-
86
-
87
-
88
-
89
-
90
-
91
-
92
-
93
-
94
-
95
-
96
-
97
-
98
-
99
-
100
-
101
-
102
-
103
-
104
-
105
-
106
-
107
-
108
-
109
-
110
-
111
-
112
-
113
-
114
-
115
-
116
-
117
-
118
-
119
-
120
-
121
-
122
-
123
-
124
-
125
-
126
-
127
-
128
-
129
-
130
-
131
-
132
-
133
-
134
-
135
-
136
-
137
-
138
-
139
-
140
-
141
-
142
-
143
-
144
-
145
-
146
-
147
-
148
-
149
-
150
-
151
-
152
-
153
-
154
-
155
-
156
-
 157
157 -
 158
158 -
 159
159 -
 160
160 -
 161
161 -
 162
162 -
 163
163 -
 164
164 -
 165
165 -
 166
166 -
 167
167 -
 168
168 -
 169
169 -
 170
170 -
 171
171 -
 172
172 -
 173
173 -
 174
174 -
 175
175 -
 176
176 -
 177
177 -
178
-
179
-
180
-
181
-
182
-
183
-
184
-
185
-
186
-
187
-
188
-
189
-
190
-
191
-
192
-
193
-
194
-
195
-
196
-
197
-
198
-
199
-
200
-
201
-
202
-
203
-
204
-
205
-
206
-
207
-
208
-
209
-
210
-
211
-
212
-
213
-
214
-
215
-
216
-
217
-
218
-
219
-
220
-
221
-
222
-
223
-
224
-
225
-
226
-
227
-
228
-
229
-
230
-
231
-
232
-
233
-
234
-
235
-
236
-
237
-
238
-
239
-
240
-
241
-
242
-
243
-
244
-
245
-
246
-
247
-
248
-
249
-
250
-
251
-
252
-
253
-
254
-
255
-
256
-
257
-
258
-
259
-
260
-
261
-
262
-
263
-
264
-
265
-
266
-
267
-
268
-
269
-
270
-
271
-
272
-
273
-
274
-
275
-
276
-
277
-
278
-
279
-
280
-
281
-
282
-
283
-
284
-
285
-
286
-
287
-
288
-
289
-
290
-
291
-
292
-
293
-
294
-
295
-
296
-
297
-
298
-
299
-
300
-
301
-
302
-
303
-
304
-
305
-
306
-
307
-
308
-
309
-
310
-
311
-
312
-
313
-
314
-
315
-
316
-
317
-
318
-
319
-
320
-
321
-
322
-
323
-
324
-
325
-
326
-
327
-
328
-
329
-
330
-
331
-
332
-
333
-
334
-
335
-
336
-
337
-
338
-
339
-
340
-
341
-
342
-
343
-
344
-
345
-
346
-
347
-
348
-
349
-
350
-
351
-
352
-
353
-
354
-
355
-
356
-
357
-
358
-
359
-
360
-
361
-
362
-
363
-
364
-
365
-
366
 |
 |

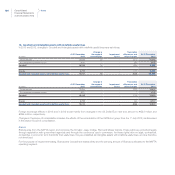
166 Consolidated
Financial Statements
at 31 December 2013
Notes
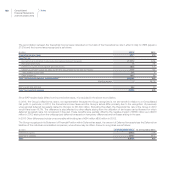
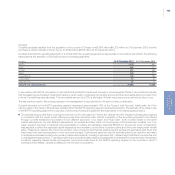
The expected future cash flows include a normalized terminal period used to estimate the future results beyond the time period explicitly
considered. This terminal period was calculated by applying to the average 2014-2017 expected revenues, an EBITDA margin of the
average of those estimated for 2014-2017; the EBITDA calculated in this way was then adjusted by a normalized amount of investments
determined assuming a steady state business and by the expected monetary contributions to pension plans and post-employment benefit
plans. As regards long-term growth rates, although it would have been reasonable to use a rate of between 2% and 3% in the market in
which the NAFTA operating segment operates, a rate of zero was used.
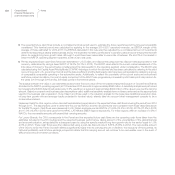
Pre-tax expected future cash flows have been estimated in U.S. Dollars, and discounted using a pre-tax discount rate appropriate for that
currency, determined by using a base WACC of 16.0% (15.1% in 2012). The WACC used reflects the current market assessment of the
time value of money for the period being considered and the risks specific to the operating segment under consideration. The WACC was
calculated using the Capital Asset Pricing Model (“CAPM”) technique in which the risk free rate has been calculated by referring to the yield
curve of long-term U.S. government bonds and the beta coefficient and the debt/equity ratio have been extrapolated by analyzing a group
of comparable companies operating in the automotive sector. Additionally, to reflect the uncertainty of the current economic environment
and future market conditions, the cost of equity component of the WACC was progressively increased by a 50 basis point risk premium for
the years 2014 through 2016 and by 300 basis points in the terminal period.
The surplus between the value in use estimated as above and the book value of the net capital employed (inclusive of Goodwill and Brands
allocated to the NAFTA operating segment) at 31 December 2013 amounts to approximately €560 million. A sensitivity analysis was performed
by increasing the WACC determined as above by 0.5%, resulting in a surplus of approximately €200 million of the value in use over the carrying
amount. Based on scenario and business plan assumptions used, additional sensitivity analysis have not been performed as the assumptions
used for the business plan preparation (“Low Case”) and those used in the valuation analysis for the base case (additional execution risks,
nil long-term growth rate and average results projected in terminal value), already take into account what management consider to be a
conservative scenario.
Impairment tests for other regions, where Goodwill was allocated, were based on the expected future cash flows covering the period from 2014
through 2017. The assumptions used to determine the pre-tax WACCs and the risk premiums were consistent with those described above
for the NAFTA region. Cash flows were measured in U.S. Dollars and base pre-tax WACCs of 14.9% (14.4% in 2012), 22.3% (17.2% in 2012)
and 17.9% (16.4% in 2012) were used for the APAC, LATAM and EMEA regions respectively. For these regions, after an increase of 0.5% in
WACCs, the recoverable amounts still exceed their carrying amounts.
For Luxury Brands, the CGU corresponds to the Ferrari and the expected future cash flows are the operating cash flows taken from the
estimates included in the 2014 budget and the expected business performance, taking account of the uncertainties of the global financial
and economic situation, extrapolated for subsequent years by using the specific medium/long-term growth rate for the sector equal to 1.0%
(2.0% in 2012). These cash flows were then discounted using a post-tax discount rate of 8.35% (8.05% in 2012). The recoverable amount
of the CGU to which the Ferrari Goodwill relates is significantly higher than its carrying amount; in addition, the exclusivity of the business, its
historical profitability and its future earnings prospects indicate that this carrying amount will continue to be recoverable, even in the event of
difficult economic and market conditions.