Chrysler 2013 Annual Report Download - page 64
Download and view the complete annual report
Please find page 64 of the 2013 Chrysler annual report below. You can navigate through the pages in the report by either clicking on the pages listed below, or by using the keyword search tool below to find specific information within the annual report.-
 1
1 -
2
-
3
-
4
-
5
-
6
-
7
-
8
-
9
-
10
-
11
-
12
-
13
-
14
-
15
-
16
-
17
-
18
-
19
-
20
-
21
-
22
-
23
-
24
-
25
-
26
-
27
-
28
-
29
-
30
-
31
-
32
-
33
-
34
-
35
-
36
-
37
-
38
-
39
-
40
-
41
-
42
-
43
-
44
-
45
-
46
-
47
-
48
-
49
-
50
-
51
-
52
-
53
-
 54
54 -
 55
55 -
 56
56 -
 57
57 -
 58
58 -
 59
59 -
 60
60 -
 61
61 -
 62
62 -
 63
63 -
 64
64 -
 65
65 -
 66
66 -
 67
67 -
 68
68 -
 69
69 -
 70
70 -
 71
71 -
 72
72 -
 73
73 -
 74
74 -
75
-
76
-
77
-
78
-
79
-
80
-
81
-
82
-
83
-
84
-
85
-
86
-
87
-
88
-
89
-
90
-
91
-
92
-
93
-
94
-
95
-
96
-
97
-
98
-
99
-
100
-
101
-
102
-
103
-
104
-
105
-
106
-
107
-
108
-
109
-
110
-
111
-
112
-
113
-
114
-
115
-
116
-
117
-
118
-
119
-
120
-
121
-
122
-
123
-
124
-
125
-
126
-
127
-
128
-
129
-
130
-
131
-
132
-
133
-
134
-
135
-
136
-
137
-
138
-
139
-
140
-
141
-
142
-
143
-
144
-
145
-
146
-
147
-
148
-
149
-
150
-
151
-
152
-
153
-
154
-
155
-
156
-
157
-
158
-
159
-
160
-
161
-
162
-
163
-
164
-
165
-
166
-
167
-
168
-
169
-
170
-
171
-
172
-
173
-
174
-
175
-
176
-
177
-
178
-
179
-
180
-
181
-
182
-
183
-
184
-
185
-
186
-
187
-
188
-
189
-
190
-
191
-
192
-
193
-
194
-
195
-
196
-
197
-
198
-
199
-
200
-
201
-
202
-
203
-
204
-
205
-
206
-
207
-
208
-
209
-
210
-
211
-
212
-
213
-
214
-
215
-
216
-
217
-
218
-
219
-
220
-
221
-
222
-
223
-
224
-
225
-
226
-
227
-
228
-
229
-
230
-
231
-
232
-
233
-
234
-
235
-
236
-
237
-
238
-
239
-
240
-
241
-
242
-
243
-
244
-
245
-
246
-
247
-
248
-
249
-
250
-
251
-
252
-
253
-
254
-
255
-
256
-
257
-
258
-
259
-
260
-
261
-
262
-
263
-
264
-
265
-
266
-
267
-
268
-
269
-
270
-
271
-
272
-
273
-
274
-
275
-
276
-
277
-
278
-
279
-
280
-
281
-
282
-
283
-
284
-
285
-
286
-
287
-
288
-
289
-
290
-
291
-
292
-
293
-
294
-
295
-
296
-
297
-
298
-
299
-
300
-
301
-
302
-
303
-
304
-
305
-
306
-
307
-
308
-
309
-
310
-
311
-
312
-
313
-
314
-
315
-
316
-
317
-
318
-
319
-
320
-
321
-
322
-
323
-
324
-
325
-
326
-
327
-
328
-
329
-
330
-
331
-
332
-
333
-
334
-
335
-
336
-
337
-
338
-
339
-
340
-
341
-
342
-
343
-
344
-
345
-
346
-
347
-
348
-
349
-
350
-
351
-
352
-
353
-
354
-
355
-
356
-
357
-
358
-
359
-
360
-
361
-
362
-
363
-
364
-
365
-
366
 |
 |

63
Report on
Operations
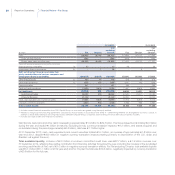
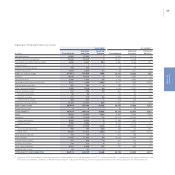
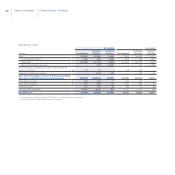
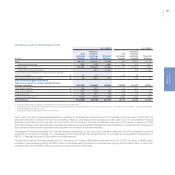
Statement of Cash Flows by Activity
2013 2012
(€ million) Consolidated
Industrial
Activities
Financial
Services Consolidated
Industrial
Activities
Financial
Services
A) Cash and cash equivalents at beginning of year 17,657 17,411 246 17,526 17,429 97
B) Cash from/(used in) operating activities:
Profit/(loss) 1,951 1,951 91 896(*) 896(*) 144
Amortization and depreciation (net of vehicles leased out) 4,574 4,572 2 4,134 4,132 2
(Gains)/losses on disposal of non-current assets
and other non-cash items (a) 545 436 18 667(*) 556(*) (33)
Dividends received 92 108 - 89 103 -
Change in provisions 444 450 (6) 77 90 (13)
Changes in deferred taxes (1,578) (1,562) (16) (72) (73) 1
Changes relating to buy-back commitments (b) 92 92 - (51) (51) -
Changes related to operating leases 1 1 - (10) (8) (2)
Change in working capital 1,468 1,464 4 714 694 20
Total 7,589 7,512 93 6,444 6,339 119
C) Cash from/(used in) investing activities:
Investments in:
Property, plant and equipment and intangible assets (net
of vehicles leased out) (7,440) (7,433) (7) (7,534) (7,530) (4)
Subsidiaries and other equity investments (231) (231) - (24) (26) -
Proceeds from the sale of non-current assets 48 47 - 139 139 -
Net change in receivables from financing activities (449) 50 (499) (24) (27) 3
Change in current securities (10) (57) 47 (64) (24) (40)
Other changes (4) (135) 131 (30) 11 (41)
Total (8,086) (7,759) (327) (7,537) (7,457) (82)
D) Cash from/(used in) financing activities:
Net change in debt and other financial assets/liabilities 3,191 2,960 231 1,679 1,536 143
Increase in share capital 4 4 - 22 22 2
Dividends paid (1) (1) (16) (58) (58) (14)
Payment of tax withholdings on behalf of shareholders of
companies outside Italy (6) (6) - ---
Total 3,188 2,957 215 1,643 1,500 131
Currency translation differences (909) (882) (27) (419) (400) (19)
E) Net change in cash and cash equivalents 1,782 1,828 (46) 131 (18) 149
F) Cash and cash equivalents at end of year 19,439 19,239 200 17,657 17,411 246
(*) Figures for 2012 have been restated to reflect application of the amendment to IAS 19. For both the Group and Industrial Activities, profit was reduced by €515 million,
with a corresponding increase in “(Gains)/losses on disposal of non-current assets and other non-cash items”.
(a) Includes reversal of gains in the fair value of equity swaps on a basket of Fiat S.p.A. and CNH Industrial N.V. shares of €27 million for 2013 and €31 million for 2012.
(b) Cash from vehicles sold under buy-back commitments for the periods reported above, net of amounts already recognized through profit and loss, is included in a separate
line item under operating activities, which also includes change in working capital.