Chrysler 2013 Annual Report Download - page 214
Download and view the complete annual report
Please find page 214 of the 2013 Chrysler annual report below. You can navigate through the pages in the report by either clicking on the pages listed below, or by using the keyword search tool below to find specific information within the annual report.-
 1
1 -
2
-
3
-
4
-
5
-
6
-
7
-
8
-
9
-
10
-
11
-
12
-
13
-
14
-
15
-
16
-
17
-
18
-
19
-
20
-
21
-
22
-
23
-
24
-
25
-
26
-
27
-
28
-
29
-
30
-
31
-
32
-
33
-
34
-
35
-
36
-
37
-
38
-
39
-
40
-
41
-
42
-
43
-
44
-
45
-
46
-
47
-
48
-
49
-
50
-
51
-
52
-
53
-
54
-
55
-
56
-
57
-
58
-
59
-
60
-
61
-
62
-
63
-
64
-
65
-
66
-
67
-
68
-
69
-
70
-
71
-
72
-
73
-
74
-
75
-
76
-
77
-
78
-
79
-
80
-
81
-
82
-
83
-
84
-
85
-
86
-
87
-
88
-
89
-
90
-
91
-
92
-
93
-
94
-
95
-
96
-
97
-
98
-
99
-
100
-
101
-
102
-
103
-
104
-
105
-
106
-
107
-
108
-
109
-
110
-
111
-
112
-
113
-
114
-
115
-
116
-
117
-
118
-
119
-
120
-
121
-
122
-
123
-
124
-
125
-
126
-
127
-
128
-
129
-
130
-
131
-
132
-
133
-
134
-
135
-
136
-
137
-
138
-
139
-
140
-
141
-
142
-
143
-
144
-
145
-
146
-
147
-
148
-
149
-
150
-
151
-
152
-
153
-
154
-
155
-
156
-
157
-
158
-
159
-
160
-
161
-
162
-
163
-
164
-
165
-
166
-
167
-
168
-
169
-
170
-
171
-
172
-
173
-
174
-
175
-
176
-
177
-
178
-
179
-
180
-
181
-
182
-
183
-
184
-
185
-
186
-
187
-
188
-
189
-
190
-
191
-
192
-
193
-
194
-
195
-
196
-
197
-
198
-
199
-
200
-
201
-
202
-
203
-
 204
204 -
 205
205 -
 206
206 -
 207
207 -
 208
208 -
 209
209 -
 210
210 -
 211
211 -
 212
212 -
 213
213 -
 214
214 -
 215
215 -
 216
216 -
 217
217 -
 218
218 -
 219
219 -
 220
220 -
 221
221 -
 222
222 -
 223
223 -
 224
224 -
225
-
226
-
227
-
228
-
229
-
230
-
231
-
232
-
233
-
234
-
235
-
236
-
237
-
238
-
239
-
240
-
241
-
242
-
243
-
244
-
245
-
246
-
247
-
248
-
249
-
250
-
251
-
252
-
253
-
254
-
255
-
256
-
257
-
258
-
259
-
260
-
261
-
262
-
263
-
264
-
265
-
266
-
267
-
268
-
269
-
270
-
271
-
272
-
273
-
274
-
275
-
276
-
277
-
278
-
279
-
280
-
281
-
282
-
283
-
284
-
285
-
286
-
287
-
288
-
289
-
290
-
291
-
292
-
293
-
294
-
295
-
296
-
297
-
298
-
299
-
300
-
301
-
302
-
303
-
304
-
305
-
306
-
307
-
308
-
309
-
310
-
311
-
312
-
313
-
314
-
315
-
316
-
317
-
318
-
319
-
320
-
321
-
322
-
323
-
324
-
325
-
326
-
327
-
328
-
329
-
330
-
331
-
332
-
333
-
334
-
335
-
336
-
337
-
338
-
339
-
340
-
341
-
342
-
343
-
344
-
345
-
346
-
347
-
348
-
349
-
350
-
351
-
352
-
353
-
354
-
355
-
356
-
357
-
358
-
359
-
360
-
361
-
362
-
363
-
364
-
365
-
366
 |
 |

213
Consolidated
Financial Statements
at 31 December 2013
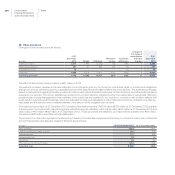
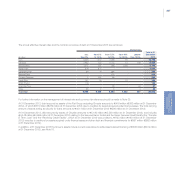
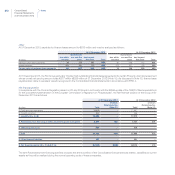
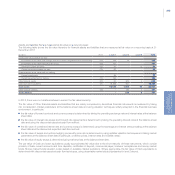
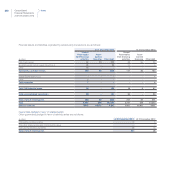
The following is reconciliation between the Net financial position as presented in the above table and Net debt as presented in the Report on
Operations:
At 31 December 2013 At 31 December 2012
(€ million) Total Fiat Group Total Fiat Group
Consolidated net debt as presented in the Report on Operations (9,793) (9,600)
Less: Current financial receivables, excluding those due from jointly controlled financial services companies,
amounting to €27 million at 31 December 2013 (€58 million at 31 December 2012), and financial receivables
for leased assets under IFRIC 4 3,644 3,669
Net financial position (6,149) (5,931)
Reference should be made to Notes 18, 19, 20 and 21 and the information provided in this Note for a further analysis of the items in the table.
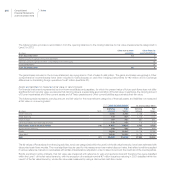
28. Trade payables
Trade payables of €17,235 million at 31 December 2013 increased by €677 million over 31 December 2012 and entirely due within one year.
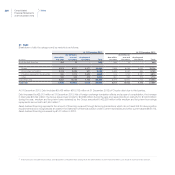
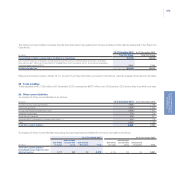
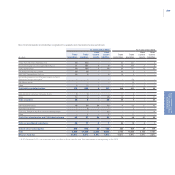
29. Other current liabilities
An analysis of Other current liabilities is as follows:
(€ million) At 31 December 2013 At 31 December 2012
Advances on buy-back agreements 1,583 1,198
Indirect tax payables 1,302 1,233
Accrued expenses and deferred income 2,364 1,920
Payables to personnel 778 728
Social security payables 343 321
Amounts due to customers for contract work (Note 17) 212 178
Other 2,361 2,203
Total Other current liabilities 8,943 7,781
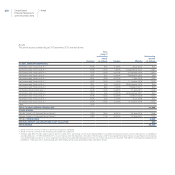
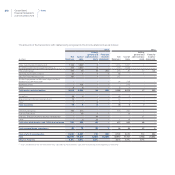
An analysis of Other current liabilities (excluding Accrued expenses and deferred income) by due date is as follows:
At 31 December 2013 At 31 December 2012
(€ million)
due within
one year
due between
one and five
years
due beyond
five years Total
due within
one year
due between
one and five
years
due beyond
five years Total
Total Other current liabilities
(excluding Accrued expenses and
deferred income) 5,717 840 22 6,579 5,124 703 34 5,861