Chrysler 2013 Annual Report Download - page 123
Download and view the complete annual report
Please find page 123 of the 2013 Chrysler annual report below. You can navigate through the pages in the report by either clicking on the pages listed below, or by using the keyword search tool below to find specific information within the annual report.-
 1
1 -
2
-
3
-
4
-
5
-
6
-
7
-
8
-
9
-
10
-
11
-
12
-
13
-
14
-
15
-
16
-
17
-
18
-
19
-
20
-
21
-
22
-
23
-
24
-
25
-
26
-
27
-
28
-
29
-
30
-
31
-
32
-
33
-
34
-
35
-
36
-
37
-
38
-
39
-
40
-
41
-
42
-
43
-
44
-
45
-
46
-
47
-
48
-
49
-
50
-
51
-
52
-
53
-
54
-
55
-
56
-
57
-
58
-
59
-
60
-
61
-
62
-
63
-
64
-
65
-
66
-
67
-
68
-
69
-
70
-
71
-
72
-
73
-
74
-
75
-
76
-
77
-
78
-
79
-
80
-
81
-
82
-
83
-
84
-
85
-
86
-
87
-
88
-
89
-
90
-
91
-
92
-
93
-
94
-
95
-
96
-
97
-
98
-
99
-
100
-
101
-
102
-
103
-
104
-
105
-
106
-
107
-
108
-
109
-
110
-
111
-
112
-
 113
113 -
 114
114 -
 115
115 -
 116
116 -
 117
117 -
 118
118 -
 119
119 -
 120
120 -
 121
121 -
 122
122 -
 123
123 -
 124
124 -
 125
125 -
 126
126 -
 127
127 -
 128
128 -
 129
129 -
 130
130 -
 131
131 -
 132
132 -
 133
133 -
134
-
135
-
136
-
137
-
138
-
139
-
140
-
141
-
142
-
143
-
144
-
145
-
146
-
147
-
148
-
149
-
150
-
151
-
152
-
153
-
154
-
155
-
156
-
157
-
158
-
159
-
160
-
161
-
162
-
163
-
164
-
165
-
166
-
167
-
168
-
169
-
170
-
171
-
172
-
173
-
174
-
175
-
176
-
177
-
178
-
179
-
180
-
181
-
182
-
183
-
184
-
185
-
186
-
187
-
188
-
189
-
190
-
191
-
192
-
193
-
194
-
195
-
196
-
197
-
198
-
199
-
200
-
201
-
202
-
203
-
204
-
205
-
206
-
207
-
208
-
209
-
210
-
211
-
212
-
213
-
214
-
215
-
216
-
217
-
218
-
219
-
220
-
221
-
222
-
223
-
224
-
225
-
226
-
227
-
228
-
229
-
230
-
231
-
232
-
233
-
234
-
235
-
236
-
237
-
238
-
239
-
240
-
241
-
242
-
243
-
244
-
245
-
246
-
247
-
248
-
249
-
250
-
251
-
252
-
253
-
254
-
255
-
256
-
257
-
258
-
259
-
260
-
261
-
262
-
263
-
264
-
265
-
266
-
267
-
268
-
269
-
270
-
271
-
272
-
273
-
274
-
275
-
276
-
277
-
278
-
279
-
280
-
281
-
282
-
283
-
284
-
285
-
286
-
287
-
288
-
289
-
290
-
291
-
292
-
293
-
294
-
295
-
296
-
297
-
298
-
299
-
300
-
301
-
302
-
303
-
304
-
305
-
306
-
307
-
308
-
309
-
310
-
311
-
312
-
313
-
314
-
315
-
316
-
317
-
318
-
319
-
320
-
321
-
322
-
323
-
324
-
325
-
326
-
327
-
328
-
329
-
330
-
331
-
332
-
333
-
334
-
335
-
336
-
337
-
338
-
339
-
340
-
341
-
342
-
343
-
344
-
345
-
346
-
347
-
348
-
349
-
350
-
351
-
352
-
353
-
354
-
355
-
356
-
357
-
358
-
359
-
360
-
361
-
362
-
363
-
364
-
365
-
366
 |
 |

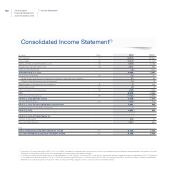
122 Consolidated
Financial Statements
at 31 December 2013
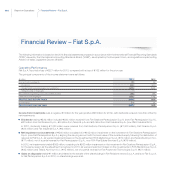
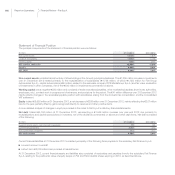
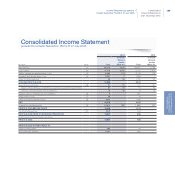
(€ million) Note 2013 2012(**)
Net revenues (1) 86,816 83,957
Cost of sales (2) 74,570 71,701
Selling, general and administrative costs (3) 6,689 6,763
Research and development costs (4) 2,231 1,850
Other income/(expenses) 68 (102)
TRADING PROFIT/(LOSS) 3,394 3,541
Result from investments: (5) 97 107
Share of the profit/(loss) of investees accounted for using the equity method 87 94
Other income/(expenses) from investments 10 13
Gains/(losses) on the disposal of investments (6) 8(91)
Restructuring costs (7) 28 15
Other unusual income/(expenses) (8) (499) (138)
EBIT 2,972 3,404
Financial income/(expenses) (9) (1,964) (1,885)
PROFIT/(LOSS) BEFORE TAXES 1,008 1,519
Tax (income)/expenses (10) (943) 623
PROFIT/(LOSS) FROM CONTINUING OPERATIONS 1,951 896
Profit/(loss) from Discontinued Operations - -
PROFIT/(LOSS) 1,951 896
PROFIT/(LOSS) ATTRIBUTABLE TO:
Owners of the parent 904 44
Non-controlling interests 1,047 852
(in €)
BASIC EARNINGS/(LOSS) PER ORDINARY SHARE (12) 0.744 0.036
DILUTED EARNINGS/(LOSS) PER ORDINARY SHARE (12) 0.736 0.036
Income Statement
Consolidated Income Statement(*)
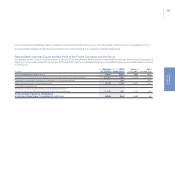
(*) Pursuant to Consob Resolution 15519 of 27 July 2006, the effects of related party transactions on the consolidated income statement are presented in the specific Income
Statement schedule provided in the following pages and are further described in Note 31.
(**) Following the retrospective application of the amendment to IAS 19 from 1 January 2013, the 2012 comparative amounts were restated as required by IAS 1. Compared
to the previously reported figures, Profit for 2012 decreased by €515 million, of which mainly €273 million in Trading Profit/EBIT and €244 million in Financial expenses.
Reference should be made to the section “New and revised IFRSs adopted since 1 January 2013” for further details.