Chrysler 2013 Annual Report Download - page 43
Download and view the complete annual report
Please find page 43 of the 2013 Chrysler annual report below. You can navigate through the pages in the report by either clicking on the pages listed below, or by using the keyword search tool below to find specific information within the annual report.-
 1
1 -
2
-
3
-
4
-
5
-
6
-
7
-
8
-
9
-
10
-
11
-
12
-
13
-
14
-
15
-
16
-
17
-
18
-
19
-
20
-
21
-
22
-
23
-
24
-
25
-
26
-
27
-
28
-
29
-
30
-
31
-
32
-
 33
33 -
 34
34 -
 35
35 -
 36
36 -
 37
37 -
 38
38 -
 39
39 -
 40
40 -
 41
41 -
 42
42 -
 43
43 -
 44
44 -
 45
45 -
 46
46 -
 47
47 -
 48
48 -
 49
49 -
 50
50 -
 51
51 -
 52
52 -
 53
53 -
54
-
55
-
56
-
57
-
58
-
59
-
60
-
61
-
62
-
63
-
64
-
65
-
66
-
67
-
68
-
69
-
70
-
71
-
72
-
73
-
74
-
75
-
76
-
77
-
78
-
79
-
80
-
81
-
82
-
83
-
84
-
85
-
86
-
87
-
88
-
89
-
90
-
91
-
92
-
93
-
94
-
95
-
96
-
97
-
98
-
99
-
100
-
101
-
102
-
103
-
104
-
105
-
106
-
107
-
108
-
109
-
110
-
111
-
112
-
113
-
114
-
115
-
116
-
117
-
118
-
119
-
120
-
121
-
122
-
123
-
124
-
125
-
126
-
127
-
128
-
129
-
130
-
131
-
132
-
133
-
134
-
135
-
136
-
137
-
138
-
139
-
140
-
141
-
142
-
143
-
144
-
145
-
146
-
147
-
148
-
149
-
150
-
151
-
152
-
153
-
154
-
155
-
156
-
157
-
158
-
159
-
160
-
161
-
162
-
163
-
164
-
165
-
166
-
167
-
168
-
169
-
170
-
171
-
172
-
173
-
174
-
175
-
176
-
177
-
178
-
179
-
180
-
181
-
182
-
183
-
184
-
185
-
186
-
187
-
188
-
189
-
190
-
191
-
192
-
193
-
194
-
195
-
196
-
197
-
198
-
199
-
200
-
201
-
202
-
203
-
204
-
205
-
206
-
207
-
208
-
209
-
210
-
211
-
212
-
213
-
214
-
215
-
216
-
217
-
218
-
219
-
220
-
221
-
222
-
223
-
224
-
225
-
226
-
227
-
228
-
229
-
230
-
231
-
232
-
233
-
234
-
235
-
236
-
237
-
238
-
239
-
240
-
241
-
242
-
243
-
244
-
245
-
246
-
247
-
248
-
249
-
250
-
251
-
252
-
253
-
254
-
255
-
256
-
257
-
258
-
259
-
260
-
261
-
262
-
263
-
264
-
265
-
266
-
267
-
268
-
269
-
270
-
271
-
272
-
273
-
274
-
275
-
276
-
277
-
278
-
279
-
280
-
281
-
282
-
283
-
284
-
285
-
286
-
287
-
288
-
289
-
290
-
291
-
292
-
293
-
294
-
295
-
296
-
297
-
298
-
299
-
300
-
301
-
302
-
303
-
304
-
305
-
306
-
307
-
308
-
309
-
310
-
311
-
312
-
313
-
314
-
315
-
316
-
317
-
318
-
319
-
320
-
321
-
322
-
323
-
324
-
325
-
326
-
327
-
328
-
329
-
330
-
331
-
332
-
333
-
334
-
335
-
336
-
337
-
338
-
339
-
340
-
341
-
342
-
343
-
344
-
345
-
346
-
347
-
348
-
349
-
350
-
351
-
352
-
353
-
354
-
355
-
356
-
357
-
358
-
359
-
360
-
361
-
362
-
363
-
364
-
365
-
366
 |
 |

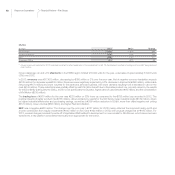
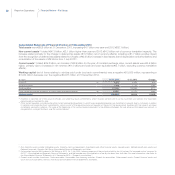
42 Report on Operations Financial Review – Fiat Group
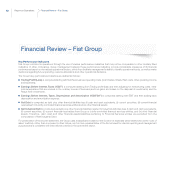
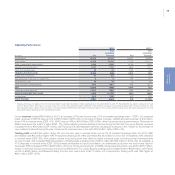
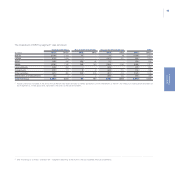
Key Performance Indicators
Fiat Group monitors its operations through the use of various performance indicators that may not be comparable to other similarly titled
indicators of other companies. Group management believes these performance indicators provide comparable measures of its financial
performance based on normalized operational factors, which then facilitate management’s ability to identify operational trends, as well as make
decisions regarding future spending, resource allocations and other operational decisions.
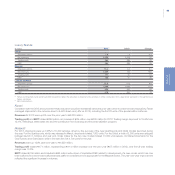
The Group’s key performance indicators are defined as follows:
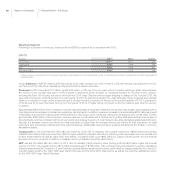
Trading Profit/(Loss) is computed starting with Net Revenues less operating costs (cost of sales, SG&A, R&D costs, other operating income
and expenses).
Earnings Before Interest, Taxes (“EBIT”) is computed starting from Trading profit/(loss) and then adjusting for restructuring costs, other
income/expenses that are unusual in the ordinary course of business (such as gains and losses on the disposal of investments) and the
Result from investments.
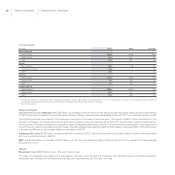
Earnings Before Interest, Taxes, Depreciation and Amortization (“EBITDA”) is computed starting with EBIT and then adding back
depreciation and amortization expense.
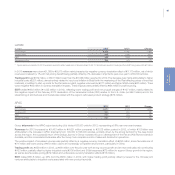
Net Debt is computed as debt plus other financial liabilities less (i) cash and cash equivalents, (ii) current securities, (iii) current financial
receivables from jointly-controlled financial services entities and (iv) other financial assets.
Net Industrial Debt is computed as debt plus other financial liabilities related to Industrial Activities less (i) cash and cash equivalents,
(ii) current securities, (iii) current financial receivables from Group or jointly-controlled financial services entities, and (iv) other financial
assets. Therefore, debt, cash and other financial assets/liabilities pertaining to Financial Services entities are excluded from the
computation of Net Industrial Debt.
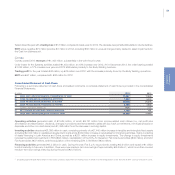
For presentation of the income statement, the Group uses a classification based on the function of expenses (otherwise known as the “cost of
sales” method), rather than one based on their nature, as it is more representative of the format used for internal reporting and management
purposes and is consistent with international practice in the automotive sector.
Financial Review – Fiat Group