Chrysler 2013 Annual Report Download - page 179
Download and view the complete annual report
Please find page 179 of the 2013 Chrysler annual report below. You can navigate through the pages in the report by either clicking on the pages listed below, or by using the keyword search tool below to find specific information within the annual report.-
 1
1 -
2
-
3
-
4
-
5
-
6
-
7
-
8
-
9
-
10
-
11
-
12
-
13
-
14
-
15
-
16
-
17
-
18
-
19
-
20
-
21
-
22
-
23
-
24
-
25
-
26
-
27
-
28
-
29
-
30
-
31
-
32
-
33
-
34
-
35
-
36
-
37
-
38
-
39
-
40
-
41
-
42
-
43
-
44
-
45
-
46
-
47
-
48
-
49
-
50
-
51
-
52
-
53
-
54
-
55
-
56
-
57
-
58
-
59
-
60
-
61
-
62
-
63
-
64
-
65
-
66
-
67
-
68
-
69
-
70
-
71
-
72
-
73
-
74
-
75
-
76
-
77
-
78
-
79
-
80
-
81
-
82
-
83
-
84
-
85
-
86
-
87
-
88
-
89
-
90
-
91
-
92
-
93
-
94
-
95
-
96
-
97
-
98
-
99
-
100
-
101
-
102
-
103
-
104
-
105
-
106
-
107
-
108
-
109
-
110
-
111
-
112
-
113
-
114
-
115
-
116
-
117
-
118
-
119
-
120
-
121
-
122
-
123
-
124
-
125
-
126
-
127
-
128
-
129
-
130
-
131
-
132
-
133
-
134
-
135
-
136
-
137
-
138
-
139
-
140
-
141
-
142
-
143
-
144
-
145
-
146
-
147
-
148
-
149
-
150
-
151
-
152
-
153
-
154
-
155
-
156
-
157
-
158
-
159
-
160
-
161
-
162
-
163
-
164
-
165
-
166
-
167
-
168
-
 169
169 -
 170
170 -
 171
171 -
 172
172 -
 173
173 -
 174
174 -
 175
175 -
 176
176 -
 177
177 -
 178
178 -
 179
179 -
 180
180 -
 181
181 -
 182
182 -
 183
183 -
 184
184 -
 185
185 -
 186
186 -
 187
187 -
 188
188 -
 189
189 -
190
-
191
-
192
-
193
-
194
-
195
-
196
-
197
-
198
-
199
-
200
-
201
-
202
-
203
-
204
-
205
-
206
-
207
-
208
-
209
-
210
-
211
-
212
-
213
-
214
-
215
-
216
-
217
-
218
-
219
-
220
-
221
-
222
-
223
-
224
-
225
-
226
-
227
-
228
-
229
-
230
-
231
-
232
-
233
-
234
-
235
-
236
-
237
-
238
-
239
-
240
-
241
-
242
-
243
-
244
-
245
-
246
-
247
-
248
-
249
-
250
-
251
-
252
-
253
-
254
-
255
-
256
-
257
-
258
-
259
-
260
-
261
-
262
-
263
-
264
-
265
-
266
-
267
-
268
-
269
-
270
-
271
-
272
-
273
-
274
-
275
-
276
-
277
-
278
-
279
-
280
-
281
-
282
-
283
-
284
-
285
-
286
-
287
-
288
-
289
-
290
-
291
-
292
-
293
-
294
-
295
-
296
-
297
-
298
-
299
-
300
-
301
-
302
-
303
-
304
-
305
-
306
-
307
-
308
-
309
-
310
-
311
-
312
-
313
-
314
-
315
-
316
-
317
-
318
-
319
-
320
-
321
-
322
-
323
-
324
-
325
-
326
-
327
-
328
-
329
-
330
-
331
-
332
-
333
-
334
-
335
-
336
-
337
-
338
-
339
-
340
-
341
-
342
-
343
-
344
-
345
-
346
-
347
-
348
-
349
-
350
-
351
-
352
-
353
-
354
-
355
-
356
-
357
-
358
-
359
-
360
-
361
-
362
-
363
-
364
-
365
-
366
 |
 |

178 Consolidated
Financial Statements
at 31 December 2013
Notes
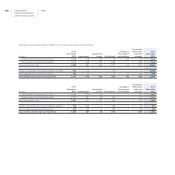
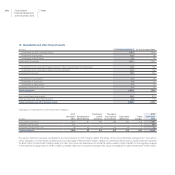
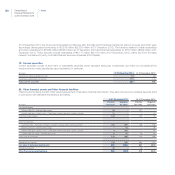
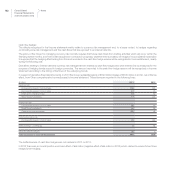
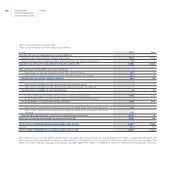
Trade receivables
Trade receivables, amounting to €2,406 million at 31 December 2013 (€2,702 million at 31 December 2012), are shown net of allowances
for doubtful accounts of €344 million at 31 December 2013 (€347 million at 31 December 2012). Changes in these allowances, which are
calculated on the basis of historical losses on receivables, were as follows in 2013:
(€ million)
At
31 December 2012 Provision
Use and other
changes
At
31 December 2013
Allowances for doubtful accounts 347 47 (50) 344
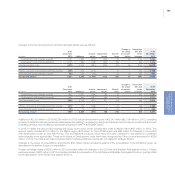
The amount of trade receivables of Chrysler at 31 December 2013 is €847 million (€909 million at 31 December 2012). Substantially all the
trade receivables of Chrysler and its U.S. subsidiary guarantors are unconditionally pledged as securities for certain debts of Chrysler (see
Note 27).
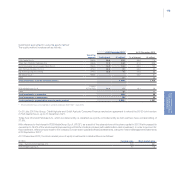
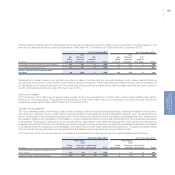
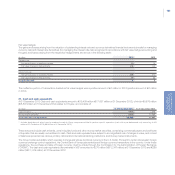
Receivables from financing activities
Receivables from financing activities mainly relate to the business of financial services companies fully consolidated by the Group (primarily
dealer and retail financing).
(€ million) At 31 December 2013 At 31 December 2012
Dealer financing 2,286 2,108
Retail financing 970 1,115
Finance leases 297 331
Other 118 173
Total Receivables from financing activities 3,671 3,727
Receivables from financing activities decreased by €56 million over the period; net of foreign exchange translation effects, mainly from changes
in the Real Brazilian/Euro rate, Receivables from financing activities increased by €331 million.
Other receivables from financing activities includes, amongst other, financial receivables from jointly controlled financial services entities (FGA
Capital group) of €27 million (€58 million at 31 December 2012) and Financial receivables from companies under joint control, associates and
unconsolidated subsidiaries of €33 million (€56 million at 31 December 2012).
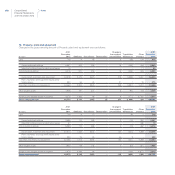
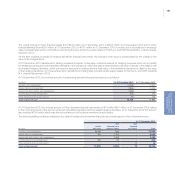
Receivables from financing activities are shown net of an allowance for doubtful accounts determined on the basis of specific insolvency risks.
At 31 December 2013, the allowance amounts to €119 million (€101 million at 31 December 2012). Changes in the allowance accounts during
the year are as follows:
(€ million)
At
31 December 2012 Provision
Use and
other changes
At
31 December 2013
Allowance for Receivables from financing activities 101 89 (71) 119