Chrysler 2013 Annual Report Download - page 48
Download and view the complete annual report
Please find page 48 of the 2013 Chrysler annual report below. You can navigate through the pages in the report by either clicking on the pages listed below, or by using the keyword search tool below to find specific information within the annual report.-
 1
1 -
2
-
3
-
4
-
5
-
6
-
7
-
8
-
9
-
10
-
11
-
12
-
13
-
14
-
15
-
16
-
17
-
18
-
19
-
20
-
21
-
22
-
23
-
24
-
25
-
26
-
27
-
28
-
29
-
30
-
31
-
32
-
33
-
34
-
35
-
36
-
37
-
 38
38 -
 39
39 -
 40
40 -
 41
41 -
 42
42 -
 43
43 -
 44
44 -
 45
45 -
 46
46 -
 47
47 -
 48
48 -
 49
49 -
 50
50 -
 51
51 -
 52
52 -
 53
53 -
 54
54 -
 55
55 -
 56
56 -
 57
57 -
 58
58 -
59
-
60
-
61
-
62
-
63
-
64
-
65
-
66
-
67
-
68
-
69
-
70
-
71
-
72
-
73
-
74
-
75
-
76
-
77
-
78
-
79
-
80
-
81
-
82
-
83
-
84
-
85
-
86
-
87
-
88
-
89
-
90
-
91
-
92
-
93
-
94
-
95
-
96
-
97
-
98
-
99
-
100
-
101
-
102
-
103
-
104
-
105
-
106
-
107
-
108
-
109
-
110
-
111
-
112
-
113
-
114
-
115
-
116
-
117
-
118
-
119
-
120
-
121
-
122
-
123
-
124
-
125
-
126
-
127
-
128
-
129
-
130
-
131
-
132
-
133
-
134
-
135
-
136
-
137
-
138
-
139
-
140
-
141
-
142
-
143
-
144
-
145
-
146
-
147
-
148
-
149
-
150
-
151
-
152
-
153
-
154
-
155
-
156
-
157
-
158
-
159
-
160
-
161
-
162
-
163
-
164
-
165
-
166
-
167
-
168
-
169
-
170
-
171
-
172
-
173
-
174
-
175
-
176
-
177
-
178
-
179
-
180
-
181
-
182
-
183
-
184
-
185
-
186
-
187
-
188
-
189
-
190
-
191
-
192
-
193
-
194
-
195
-
196
-
197
-
198
-
199
-
200
-
201
-
202
-
203
-
204
-
205
-
206
-
207
-
208
-
209
-
210
-
211
-
212
-
213
-
214
-
215
-
216
-
217
-
218
-
219
-
220
-
221
-
222
-
223
-
224
-
225
-
226
-
227
-
228
-
229
-
230
-
231
-
232
-
233
-
234
-
235
-
236
-
237
-
238
-
239
-
240
-
241
-
242
-
243
-
244
-
245
-
246
-
247
-
248
-
249
-
250
-
251
-
252
-
253
-
254
-
255
-
256
-
257
-
258
-
259
-
260
-
261
-
262
-
263
-
264
-
265
-
266
-
267
-
268
-
269
-
270
-
271
-
272
-
273
-
274
-
275
-
276
-
277
-
278
-
279
-
280
-
281
-
282
-
283
-
284
-
285
-
286
-
287
-
288
-
289
-
290
-
291
-
292
-
293
-
294
-
295
-
296
-
297
-
298
-
299
-
300
-
301
-
302
-
303
-
304
-
305
-
306
-
307
-
308
-
309
-
310
-
311
-
312
-
313
-
314
-
315
-
316
-
317
-
318
-
319
-
320
-
321
-
322
-
323
-
324
-
325
-
326
-
327
-
328
-
329
-
330
-
331
-
332
-
333
-
334
-
335
-
336
-
337
-
338
-
339
-
340
-
341
-
342
-
343
-
344
-
345
-
346
-
347
-
348
-
349
-
350
-
351
-
352
-
353
-
354
-
355
-
356
-
357
-
358
-
359
-
360
-
361
-
362
-
363
-
364
-
365
-
366
 |
 |

47
Report on
Operations
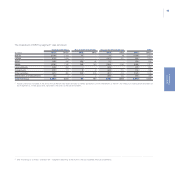
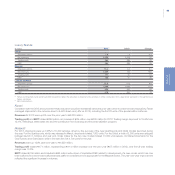
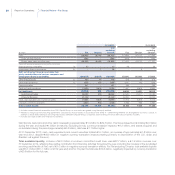
LATAM
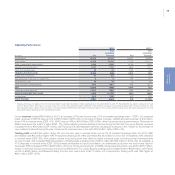
(€ million) 2013 2012(*) Change
Net revenues 9,973 11,062 -1,089
Trading profit 619 1,056 -437
EBIT 492 1,025 -533
Shipments (000s) 950 979 -29
(*) Figures previously reported for 2012 have been restated to reflect application of the amendment to IAS 19. Restatement resulted in trading profit and EBIT being reduced by €7 million.
In 2013 revenues were down €1,089 to €9,973 million mainly impacted by negative currency translation effect of €1,170 million, net of which
revenues increased by 1% with net pricing benefit being partially offset by 3% decrease in shipments year-over-year to 950,000 vehicles.
Trading profit was €619 million, or €437 million lower than the €1,056 million reported for 2012. The decrease was mainly attributable to higher
industrial costs (€257 million), almost entirely related to input cost inflation in Brazil (with the weakening of the Real affecting prices of imported
materials), in addition to start-up costs for the Pernambuco plant, negative volumes/mix (€111 million) and higher SG&A costs (€37 million). There
was a negative €85 million in currency translation impacts. These impacts were partially offset by €64 million in positive pricing.
EBIT totaled €492 million (€1,025 million in 2012), reflecting lower trading profit and net unusual charges of €127 million, mainly related to
the negative impact of the February 2013 devaluation of the Venezuelan bolivar (VEF) relative to the U.S. dollar (net €43 million) and to the
streamlining of architectures and models associated with the region’s refocused product strategy (€75 million).
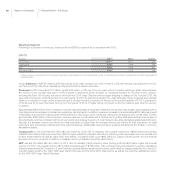
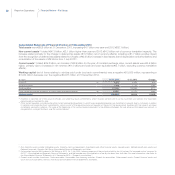
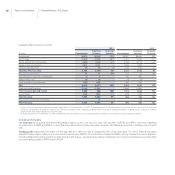
APAC
(€ million) 2013 2012 Change
Net revenues 4,621 3,128 1,493
Trading profit 358 260 98
EBIT 318 255 63
Shipments (000s) 163 103 60
Group shipments in the APAC region (excluding JVs) totaled 163,000 units for 2013, representing a 58% year-over-year increase.
Revenues for 2013 increased by €1,493 million to €4,621 million compared to €3,128 million posted in 2012, of which €1.8 billion was
attributable to the increase in APAC shipments from 103,000 to 163,000 vehicles, primarily driven by the strong demand for the Jeep brand
across the region, the successful return of the Dodge Journey in China, increased focus on development of the Fiat and Alfa Romeo brands in
Australia, and the consolidated India sales after the Group took complete control of sales and distribution operations.
The positive impact of increased volumes was partially offset by a negative currency translation effect of €200 million, a less favorable mix of
€71 million and lower pricing of €79 million due to an increasingly competitive environment, particularly in China.
Trading profit was €358 million in 2013, up €98 million over the prior year with strong volume growth and an improved sales mix contributing
€423 million, partially offset by higher industrial costs (€106 million) and SG&A expenses (€72 million) to support Group growth in the region,
as well as less favorable pricing (€79 million) and unfavorable currency translation effects (€13 million).
EBIT totaled €318 million, up 25% from the €255 million in 2012, with higher trading profit partially offset by losses for the Chinese joint
ventures attributable to industrial costs associated with new product launches.