Asus 2015 Annual Report Download - page 276
Download and view the complete annual report
Please find page 276 of the 2015 Asus annual report below. You can navigate through the pages in the report by either clicking on the pages listed below, or by using the keyword search tool below to find specific information within the annual report.-
 1
1 -
2
-
3
-
4
-
5
-
6
-
7
-
8
-
9
-
10
-
11
-
12
-
13
-
14
-
15
-
16
-
17
-
18
-
19
-
20
-
21
-
22
-
23
-
24
-
25
-
26
-
27
-
28
-
29
-
30
-
31
-
32
-
33
-
34
-
35
-
36
-
37
-
38
-
39
-
40
-
41
-
42
-
43
-
44
-
45
-
46
-
47
-
48
-
49
-
50
-
51
-
52
-
53
-
54
-
55
-
56
-
57
-
58
-
59
-
60
-
61
-
62
-
63
-
64
-
65
-
66
-
67
-
68
-
69
-
70
-
71
-
72
-
73
-
74
-
75
-
76
-
77
-
78
-
79
-
80
-
81
-
82
-
83
-
84
-
85
-
86
-
87
-
88
-
89
-
90
-
91
-
92
-
93
-
94
-
95
-
96
-
97
-
98
-
99
-
100
-
101
-
102
-
103
-
104
-
105
-
106
-
107
-
108
-
109
-
110
-
111
-
112
-
113
-
114
-
115
-
116
-
117
-
118
-
119
-
120
-
121
-
122
-
123
-
124
-
125
-
126
-
127
-
128
-
129
-
130
-
131
-
132
-
133
-
134
-
135
-
136
-
137
-
138
-
139
-
140
-
141
-
142
-
143
-
144
-
145
-
146
-
147
-
148
-
149
-
150
-
151
-
152
-
153
-
154
-
155
-
156
-
157
-
158
-
159
-
160
-
161
-
162
-
163
-
164
-
165
-
166
-
167
-
168
-
169
-
170
-
171
-
172
-
173
-
174
-
175
-
176
-
177
-
178
-
179
-
180
-
181
-
182
-
183
-
184
-
185
-
186
-
187
-
188
-
189
-
190
-
191
-
192
-
193
-
194
-
195
-
196
-
197
-
198
-
199
-
200
-
201
-
202
-
203
-
204
-
205
-
206
-
207
-
208
-
209
-
210
-
211
-
212
-
213
-
214
-
215
-
216
-
217
-
218
-
219
-
220
-
221
-
222
-
223
-
224
-
225
-
226
-
227
-
228
-
229
-
230
-
231
-
232
-
233
-
234
-
235
-
236
-
237
-
238
-
239
-
240
-
241
-
242
-
243
-
244
-
245
-
246
-
247
-
248
-
249
-
250
-
251
-
252
-
253
-
254
-
255
-
256
-
257
-
258
-
259
-
260
-
261
-
262
-
263
-
264
-
265
-
 266
266 -
 267
267 -
 268
268 -
 269
269 -
 270
270 -
 271
271 -
 272
272 -
 273
273 -
 274
274 -
 275
275 -
 276
276 -
 277
277 -
 278
278 -
 279
279
 |
 |

272
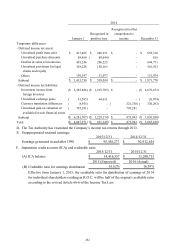
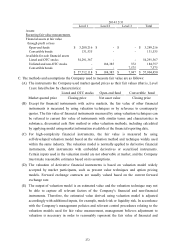
C. The methods and assumptions the Company used to measure fair value are as follows:
(A) The instruments the Company used market quoted prices as their fair values (that is, Level
1) are listed below by characteristics:
(B) Except for financial instruments with active markets, the fair value of other financial
instruments is measured by using valuation techniques or by reference to counterparty
quotes. The fair value of financial instruments measured by using valuation techniques can
be referred to current fair value of instruments with similar terms and characteristics in
substance, discounted cash flow method or other valuation methods, including calculated
by applying model using market information available at the financial reporting date.
(C) For high-complexity financial instruments, the fair value is measured by using
self-developed valuation model based on the valuation method and technique widely used
within the same industry. The valuation model is normally applied to derivative financial
instruments, debt instruments with embedded derivatives or securitised instruments.
Certain inputs used in the valuation model are not observable at market, and the Company
must make reasonable estimates based on its assumptions.
(D) The valuation of derivative financial instruments is based on valuation model widely
accepted by market participants, such as present value techniques and option pricing
models. Forward exchange contracts are usually valued based on the current forward
exchange rate.
(E) The output of valuation model is an estimated value and the valuation technique may not
be able to capture all relevant factors of the Company’s financial and non-financial
instruments. Therefore, the estimated value derived using valuation model is adjusted
accordingly with additional inputs, for example, model risk or liquidity risk. In accordance
with the Company’s management policies and relevant control procedures relating to the
valuation models used for fair value measurement, management believes adjustment to
valuation is necessary in order to reasonably represent the fair value of financial and
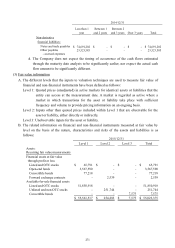
Level 1 Level 2 Level 3 Total
Assets:
Recurring fair value measurements
Financial assets at fair value
through profit or loss
Open-end funds 3,289,216$ -$ -$ 3,289,216$
Convertible bonds 131,535 - - 131,535
Available-for-sale financial assets
Listed and OTC stocks 54,291,367 - - 54,291,367
Unlisted and non-OTC stocks - 184,385 372 184,757
Convertible bonds - - 7,575 7,575
57,712,118$ 184,385$ 7,947$ 57,904,450$
2014/12/31
Listed and OTC stocks Open-end fund Convertible bond
Market quoted price Closing price Net asset value Closing price