Asus 2015 Annual Report Download - page 197
Download and view the complete annual report
Please find page 197 of the 2015 Asus annual report below. You can navigate through the pages in the report by either clicking on the pages listed below, or by using the keyword search tool below to find specific information within the annual report.-
 1
1 -
2
-
3
-
4
-
5
-
6
-
7
-
8
-
9
-
10
-
11
-
12
-
13
-
14
-
15
-
16
-
17
-
18
-
19
-
20
-
21
-
22
-
23
-
24
-
25
-
26
-
27
-
28
-
29
-
30
-
31
-
32
-
33
-
34
-
35
-
36
-
37
-
38
-
39
-
40
-
41
-
42
-
43
-
44
-
45
-
46
-
47
-
48
-
49
-
50
-
51
-
52
-
53
-
54
-
55
-
56
-
57
-
58
-
59
-
60
-
61
-
62
-
63
-
64
-
65
-
66
-
67
-
68
-
69
-
70
-
71
-
72
-
73
-
74
-
75
-
76
-
77
-
78
-
79
-
80
-
81
-
82
-
83
-
84
-
85
-
86
-
87
-
88
-
89
-
90
-
91
-
92
-
93
-
94
-
95
-
96
-
97
-
98
-
99
-
100
-
101
-
102
-
103
-
104
-
105
-
106
-
107
-
108
-
109
-
110
-
111
-
112
-
113
-
114
-
115
-
116
-
117
-
118
-
119
-
120
-
121
-
122
-
123
-
124
-
125
-
126
-
127
-
128
-
129
-
130
-
131
-
132
-
133
-
134
-
135
-
136
-
137
-
138
-
139
-
140
-
141
-
142
-
143
-
144
-
145
-
146
-
147
-
148
-
149
-
150
-
151
-
152
-
153
-
154
-
155
-
156
-
157
-
158
-
159
-
160
-
161
-
162
-
163
-
164
-
165
-
166
-
167
-
168
-
169
-
170
-
171
-
172
-
173
-
174
-
175
-
176
-
177
-
178
-
179
-
180
-
181
-
182
-
183
-
184
-
185
-
186
-
 187
187 -
 188
188 -
 189
189 -
 190
190 -
 191
191 -
 192
192 -
 193
193 -
 194
194 -
 195
195 -
 196
196 -
 197
197 -
 198
198 -
 199
199 -
 200
200 -
 201
201 -
 202
202 -
 203
203 -
 204
204 -
 205
205 -
 206
206 -
 207
207 -
208
-
209
-
210
-
211
-
212
-
213
-
214
-
215
-
216
-
217
-
218
-
219
-
220
-
221
-
222
-
223
-
224
-
225
-
226
-
227
-
228
-
229
-
230
-
231
-
232
-
233
-
234
-
235
-
236
-
237
-
238
-
239
-
240
-
241
-
242
-
243
-
244
-
245
-
246
-
247
-
248
-
249
-
250
-
251
-
252
-
253
-
254
-
255
-
256
-
257
-
258
-
259
-
260
-
261
-
262
-
263
-
264
-
265
-
266
-
267
-
268
-
269
-
270
-
271
-
272
-
273
-
274
-
275
-
276
-
277
-
278
-
279
 |
 |

193
~41~
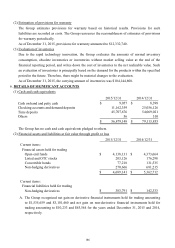
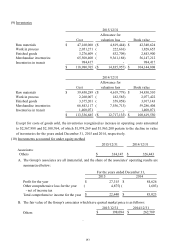
(9) Inventories
Except for costs of goods sold, the inventories recognized as increase in operating costs amounted
to $2,367,988 and $2,108,764, of which $1,974,269 and $1,963,200 pertain to the decline in value
of inventories for the years ended December 31, 2015 and 2014, respectively.
(10) Investments accounted for under equity method
A. The Group’s associates are all immaterial, and the share of the associates’ operating results are
summarized below:
B. The fair value of the Group’s associates which have quoted market price is as follows:
Cost
Allowance for
valuation loss
Book value
Raw materials 47,160,068$ 4,819,444)($ 42,340,624$
Work in process 2,051,271 222,616)( 1,828,655
Finished goods 3,276,609 432,709)( 2,843,900
Merchandise inventories 65,508,400 9,361,188)( 56,147,212
Inventories in transit 984,417 - 984,417
118,980,765$ 14,835,957)($ 104,144,808$
2015/12/31
Cost
Allowance for
valuation loss
Book value
Raw materials 39,450,289$ 4,619,779)($ 34,830,510$
Work in process 2,260,007 182,585)( 2,077,422
Finished goods 3,375,201 358,058)( 3,017,143
Merchandise inventories 66,843,117 7,556,713)( 59,286,404
Inventories in transit 1,408,071 - 1,408,071
113,336,685$ 12,717,135)($ 100,619,550$
2014/12/31
2015/12/31 2014/12/31
Associates:
Others 334,147$ 326,443$
2015 2014
Profit for the year 27,315$ 84,626$
Other comprehensive loss for the year 4,875)( 1,603)(
- net of income tax
Total comprehensive income for the year 22,440$ 83,023$
For the years ended December 31,
2015/12/31 2014/12/31
Others 198,094$ 262,789$