Asus 2015 Annual Report Download - page 199
Download and view the complete annual report
Please find page 199 of the 2015 Asus annual report below. You can navigate through the pages in the report by either clicking on the pages listed below, or by using the keyword search tool below to find specific information within the annual report.-
 1
1 -
2
-
3
-
4
-
5
-
6
-
7
-
8
-
9
-
10
-
11
-
12
-
13
-
14
-
15
-
16
-
17
-
18
-
19
-
20
-
21
-
22
-
23
-
24
-
25
-
26
-
27
-
28
-
29
-
30
-
31
-
32
-
33
-
34
-
35
-
36
-
37
-
38
-
39
-
40
-
41
-
42
-
43
-
44
-
45
-
46
-
47
-
48
-
49
-
50
-
51
-
52
-
53
-
54
-
55
-
56
-
57
-
58
-
59
-
60
-
61
-
62
-
63
-
64
-
65
-
66
-
67
-
68
-
69
-
70
-
71
-
72
-
73
-
74
-
75
-
76
-
77
-
78
-
79
-
80
-
81
-
82
-
83
-
84
-
85
-
86
-
87
-
88
-
89
-
90
-
91
-
92
-
93
-
94
-
95
-
96
-
97
-
98
-
99
-
100
-
101
-
102
-
103
-
104
-
105
-
106
-
107
-
108
-
109
-
110
-
111
-
112
-
113
-
114
-
115
-
116
-
117
-
118
-
119
-
120
-
121
-
122
-
123
-
124
-
125
-
126
-
127
-
128
-
129
-
130
-
131
-
132
-
133
-
134
-
135
-
136
-
137
-
138
-
139
-
140
-
141
-
142
-
143
-
144
-
145
-
146
-
147
-
148
-
149
-
150
-
151
-
152
-
153
-
154
-
155
-
156
-
157
-
158
-
159
-
160
-
161
-
162
-
163
-
164
-
165
-
166
-
167
-
168
-
169
-
170
-
171
-
172
-
173
-
174
-
175
-
176
-
177
-
178
-
179
-
180
-
181
-
182
-
183
-
184
-
185
-
186
-
187
-
188
-
 189
189 -
 190
190 -
 191
191 -
 192
192 -
 193
193 -
 194
194 -
 195
195 -
 196
196 -
 197
197 -
 198
198 -
 199
199 -
 200
200 -
 201
201 -
 202
202 -
 203
203 -
 204
204 -
 205
205 -
 206
206 -
 207
207 -
 208
208 -
 209
209 -
210
-
211
-
212
-
213
-
214
-
215
-
216
-
217
-
218
-
219
-
220
-
221
-
222
-
223
-
224
-
225
-
226
-
227
-
228
-
229
-
230
-
231
-
232
-
233
-
234
-
235
-
236
-
237
-
238
-
239
-
240
-
241
-
242
-
243
-
244
-
245
-
246
-
247
-
248
-
249
-
250
-
251
-
252
-
253
-
254
-
255
-
256
-
257
-
258
-
259
-
260
-
261
-
262
-
263
-
264
-
265
-
266
-
267
-
268
-
269
-
270
-
271
-
272
-
273
-
274
-
275
-
276
-
277
-
278
-
279
 |
 |

195
~43~
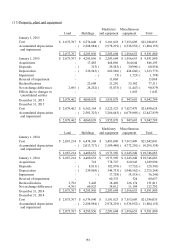
A. After evaluating and comparing the carrying amount of property, plant and equipment and its
recoverable amounts, the Group recognized impairment loss amounting to $1,798 and $36,246,
and reversal gain amounting to $13,068 and $60,657 for the years ended December 31, 2015
and 2014, respectively.
B. Information about the property, plant and equipment that are pledged to others as collateral is
provided in Note 8.
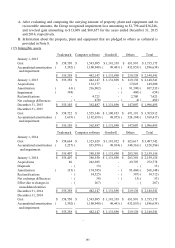
(12) Intangible assets
Trademark
Computer software
Goodwill Others Total
January 1, 2015
Cost 358,750$ 1,543,095$ 1,181,339$ 651,991$ 3,735,175$
Accumulated amortisation 3,392)( 1,100,948)( 49,441)( 432,853)( 1,586,634)(
and impairment
355,358$ 442,147$ 1,131,898$ 219,138$ 2,148,541$
January 1, 2015 355,358$ 442,147$ 1,131,898$ 219,138$ 2,148,541$
Acquisitions - 132,177 - 17,023 149,200
Amortisation 61)( 216,082)( - 91,390)( 307,533)(
Impairment 194)( - - 460)( 654)(
Reclassifications - 4,723 - 2,700 7,423
Net exchange differences - 478)( - 4)( 482)(
December 31, 2015 355,103$ 362,487$ 1,131,898$ 147,007$ 1,996,495$
December 31, 2015
Cost 358,722$ 1,555,146$ 1,180,853$ 671,191$ 3,765,912$
Accumulated amortisation 3,619)( 1,192,659)( 48,955)( 524,184)( 1,769,417)(
and impairment
355,103$ 362,487$ 1,131,898$ 147,007$ 1,996,495$
Trademark
Computer software
Goodwill Others Total
January 1, 2014
Cost 358,664$ 1,323,629$ 1,181,832$ 623,617$ 3,487,742$
Accumulated amortisation 3,257)( 935,079)( 49,934)( 340,316)( 1,328,586)(
and impairment
355,407$ 388,550$ 1,131,898$ 283,301$ 2,159,156$
January 1, 2014 355,407$ 388,550$ 1,131,898$ 283,301$ 2,159,156$
Acquisitions 86 242,985 - 29,707 272,778
Disposals - 13)( - - 13)(
Amortisation 135)( 174,745)( - 93,468)( 268,348)(
Reclassifications - 14,325)( - 387)( 14,712)(
Net exchange differences - 38)( - 15)( 53)(
Effect due to changes in - 267)( - - 267)(
consolidated entities
December 31, 2014 355,358$ 442,147$ 1,131,898$ 219,138$ 2,148,541$
December 31, 2014
Cost 358,750$ 1,543,095$ 1,181,339$ 651,991$ 3,735,175$
Accumulated amortisation 3,392)( 1,100,948)( 49,441)( 432,853)( 1,586,634)(
and impairment
355,358$ 442,147$ 1,131,898$ 219,138$ 2,148,541$