Asus 2015 Annual Report Download - page 164
Download and view the complete annual report
Please find page 164 of the 2015 Asus annual report below. You can navigate through the pages in the report by either clicking on the pages listed below, or by using the keyword search tool below to find specific information within the annual report.-
 1
1 -
2
-
3
-
4
-
5
-
6
-
7
-
8
-
9
-
10
-
11
-
12
-
13
-
14
-
15
-
16
-
17
-
18
-
19
-
20
-
21
-
22
-
23
-
24
-
25
-
26
-
27
-
28
-
29
-
30
-
31
-
32
-
33
-
34
-
35
-
36
-
37
-
38
-
39
-
40
-
41
-
42
-
43
-
44
-
45
-
46
-
47
-
48
-
49
-
50
-
51
-
52
-
53
-
54
-
55
-
56
-
57
-
58
-
59
-
60
-
61
-
62
-
63
-
64
-
65
-
66
-
67
-
68
-
69
-
70
-
71
-
72
-
73
-
74
-
75
-
76
-
77
-
78
-
79
-
80
-
81
-
82
-
83
-
84
-
85
-
86
-
87
-
88
-
89
-
90
-
91
-
92
-
93
-
94
-
95
-
96
-
97
-
98
-
99
-
100
-
101
-
102
-
103
-
104
-
105
-
106
-
107
-
108
-
109
-
110
-
111
-
112
-
113
-
114
-
115
-
116
-
117
-
118
-
119
-
120
-
121
-
122
-
123
-
124
-
125
-
126
-
127
-
128
-
129
-
130
-
131
-
132
-
133
-
134
-
135
-
136
-
137
-
138
-
139
-
140
-
141
-
142
-
143
-
144
-
145
-
146
-
147
-
148
-
149
-
150
-
151
-
152
-
153
-
 154
154 -
 155
155 -
 156
156 -
 157
157 -
 158
158 -
 159
159 -
 160
160 -
 161
161 -
 162
162 -
 163
163 -
 164
164 -
 165
165 -
 166
166 -
 167
167 -
 168
168 -
 169
169 -
 170
170 -
 171
171 -
 172
172 -
 173
173 -
 174
174 -
175
-
176
-
177
-
178
-
179
-
180
-
181
-
182
-
183
-
184
-
185
-
186
-
187
-
188
-
189
-
190
-
191
-
192
-
193
-
194
-
195
-
196
-
197
-
198
-
199
-
200
-
201
-
202
-
203
-
204
-
205
-
206
-
207
-
208
-
209
-
210
-
211
-
212
-
213
-
214
-
215
-
216
-
217
-
218
-
219
-
220
-
221
-
222
-
223
-
224
-
225
-
226
-
227
-
228
-
229
-
230
-
231
-
232
-
233
-
234
-
235
-
236
-
237
-
238
-
239
-
240
-
241
-
242
-
243
-
244
-
245
-
246
-
247
-
248
-
249
-
250
-
251
-
252
-
253
-
254
-
255
-
256
-
257
-
258
-
259
-
260
-
261
-
262
-
263
-
264
-
265
-
266
-
267
-
268
-
269
-
270
-
271
-
272
-
273
-
274
-
275
-
276
-
277
-
278
-
279
 |
 |

160
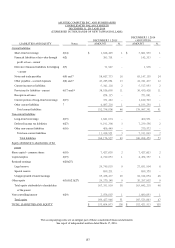
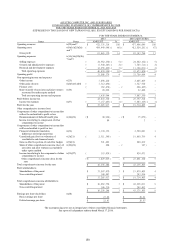
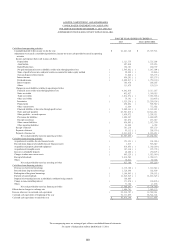
ASUSTEK COMPUTER INC. AND SUBSIDIARIES
CONSOLIDATED STATEMENTS OF CASH FLOWS
FOR THE YEARS ENDED DECEMBER 31, 2015 AND 2014
(EXPRESSED IN THOUSANDS OF NEW TAIWAN DOLLARS)
FOR THE YEARS ENDED DECEMBER 31,
2015 2014 (ADJUSTED)
The accompanying notes are an integral part of these consolidated financial statements.
See report of independent auditors dated March 17, 2016.
Cash flows from operating activities
Consolidated profit before income tax for the year % 33-554-431 % 36-4:8-625
Adjustments to reconcile consolidated profit before income tax to net cash provided by (used in) operating
activities
Income and expenses that result in non-cash flows
Depreciation 2-434-886 3-836-375
Amortisation 518-949 483-964
Bad debt provision 275-292 371-818
Net gain on financial assets or liabilities at fair value through profit or loss ) 2-656-9:3 * ) 4-258-115 *
Share of profit of associates and joint ventures accounted for under equity method ) 31-7:7 * ) 33-597 *
Gain on disposal of investments ) 82-951 * ) 4:7-246 *
Interest income ) 7:9-314 * ) 766-28: *
Dividend income ) 3-511-128 * ) 2-861-341 *
Interest expense 47:-589 379-376
Others 244-98: 241-321
Changes in assets/liabilities relating to operating activities
Financial assets at fair value through profit or loss 5-:53-927 :-424-:38
Notes receivable 963-538 2-471-126
Trade receivables ) 4-923-:83 * ) 8-183-949 *
Other receivables 86-472 ) 421-569 *
Inventories ) 4-636-369 * ) 34-3:1-649 *
Prepayments 569-973 ) 616-65: *
Other current assets 22-::5 883-713
Financial liabilities at fair value through profit or loss ) 3-591-454 * ) 2-443-932 *
Notes and trade payables ) 37-614-127 * 2:-923-:32
Other payables - accrued expenses 2-761-:83 3-316-622
Provisions for liabilities 2-717-378 4-:91-::6
Receipts in advance 214-185 344-128
Other current liabilities ) 565-116 * 3-183-8:1
Other operating liabilities 34-75: 7-893
Receipt of interest 814-347 766-28:
Payment of interest ) :6-443 * ) 316-687 *
Payment of income tax ) 5-342-521 * ) 5-787-962 *
Net cash provided by (used in) operating activities ) 21-678-966 * 37-313-998
Cash flows from investing activities
Acquisition of available-for-sale financial assets ) 264-434 * ) 245-497 *
Proceeds from disposal of available-for-sale financial assets 4-:46 6:7-758
Acquisition of property, plant and equipment ) 949-96: * ) 2-49:-::1 *
Acquisition of intangible assets ) 258-449 * ) 383-889 *
Increase in refundable deposits ) 39-511 * ) 261-5:6 *
Changes in other non-current assets ) 756-23: * ) 2-143-251 *
Receipt of dividends 3-52:-693 2-871-226
Others 27-:23 68-839
Net cash provided by (used in) investing activities 738-491 ) 676-3:: *
Cash flows from financing activities
Decrease in short-term borrowings ) 3-227-491 * ) 2-22:-953 *
Proceeds from long-term borrowings 2-839-:77 413-91:
Redemption of long-term borrowings ) 2-295-176 * ) 417-2:3 *
Payment of cash dividends ) 23-737-:36 * ) 25-594-936 *
Disposal of ownership interests in subsidiaries (without losing control) 4:9-196 .
Change in non-controlling interest ) 282-:89 * ) 249-587 *
Others 82-415 22-577
Net cash provided by (used in) financing activities ) 24-:11-::4 * ) 26-845-171 *
Effects due to changes in exchange rate 2-717-872 3-797-244
Increase (decrease) in cash and cash equivalents ) 33-345-818 * 23-69:-772
Cash and cash equivalents at beginning of the year 8:-224-966 77-635-2:5
Cash and cash equivalents at end of the year % 67-98:-259 % 8:-224-966