Asus 2015 Annual Report Download - page 256
Download and view the complete annual report
Please find page 256 of the 2015 Asus annual report below. You can navigate through the pages in the report by either clicking on the pages listed below, or by using the keyword search tool below to find specific information within the annual report.-
 1
1 -
2
-
3
-
4
-
5
-
6
-
7
-
8
-
9
-
10
-
11
-
12
-
13
-
14
-
15
-
16
-
17
-
18
-
19
-
20
-
21
-
22
-
23
-
24
-
25
-
26
-
27
-
28
-
29
-
30
-
31
-
32
-
33
-
34
-
35
-
36
-
37
-
38
-
39
-
40
-
41
-
42
-
43
-
44
-
45
-
46
-
47
-
48
-
49
-
50
-
51
-
52
-
53
-
54
-
55
-
56
-
57
-
58
-
59
-
60
-
61
-
62
-
63
-
64
-
65
-
66
-
67
-
68
-
69
-
70
-
71
-
72
-
73
-
74
-
75
-
76
-
77
-
78
-
79
-
80
-
81
-
82
-
83
-
84
-
85
-
86
-
87
-
88
-
89
-
90
-
91
-
92
-
93
-
94
-
95
-
96
-
97
-
98
-
99
-
100
-
101
-
102
-
103
-
104
-
105
-
106
-
107
-
108
-
109
-
110
-
111
-
112
-
113
-
114
-
115
-
116
-
117
-
118
-
119
-
120
-
121
-
122
-
123
-
124
-
125
-
126
-
127
-
128
-
129
-
130
-
131
-
132
-
133
-
134
-
135
-
136
-
137
-
138
-
139
-
140
-
141
-
142
-
143
-
144
-
145
-
146
-
147
-
148
-
149
-
150
-
151
-
152
-
153
-
154
-
155
-
156
-
157
-
158
-
159
-
160
-
161
-
162
-
163
-
164
-
165
-
166
-
167
-
168
-
169
-
170
-
171
-
172
-
173
-
174
-
175
-
176
-
177
-
178
-
179
-
180
-
181
-
182
-
183
-
184
-
185
-
186
-
187
-
188
-
189
-
190
-
191
-
192
-
193
-
194
-
195
-
196
-
197
-
198
-
199
-
200
-
201
-
202
-
203
-
204
-
205
-
206
-
207
-
208
-
209
-
210
-
211
-
212
-
213
-
214
-
215
-
216
-
217
-
218
-
219
-
220
-
221
-
222
-
223
-
224
-
225
-
226
-
227
-
228
-
229
-
230
-
231
-
232
-
233
-
234
-
235
-
236
-
237
-
238
-
239
-
240
-
241
-
242
-
243
-
244
-
245
-
 246
246 -
 247
247 -
 248
248 -
 249
249 -
 250
250 -
 251
251 -
 252
252 -
 253
253 -
 254
254 -
 255
255 -
 256
256 -
 257
257 -
 258
258 -
 259
259 -
 260
260 -
 261
261 -
 262
262 -
 263
263 -
 264
264 -
 265
265 -
 266
266 -
267
-
268
-
269
-
270
-
271
-
272
-
273
-
274
-
275
-
276
-
277
-
278
-
279
 |
 |

252
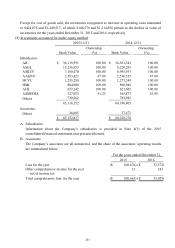
Group 1:
Insured, or guaranteed by the third party, or the trading object is subsidiary or
associate.
Group 2:
Neither insured and guaranteed by the third party, nor the trading object is subsidiary
or associate.
D. The Company does not hold any collateral as security.
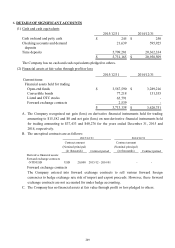
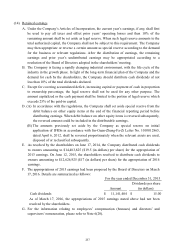
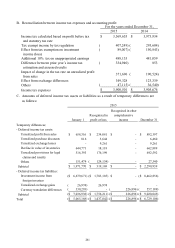
(6) Offsetting financial assets and financial liabilities
A. The Company has assets (fair value of $39,891,827 and $44,076,377 on December 31, 2015
and 2014, respectively) and liabilities (fair value of $46,830,179 and 55,537,981 on December
31, 2015 and 2014, respectively) with certain companies that meet the offsetting criteria in
paragraph 42 of IAS 32, resulting in the presentation of a net amount for trade receivables,
notes payable, trade payables and other payables – accrued expenses.
B. Financial assets and financial liabilities subject to master netting arrangements are as follows:
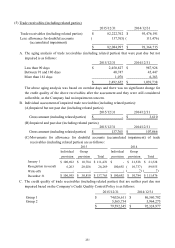
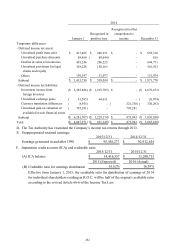
(7) Inventories
Gross amouts of
financial assets
(before offset)
Gross amouts of
financial liabilities
(before offset)
Gross amouts of
financial liabilities
set off
Amounts of
financial assets
presented in the
balance sheet
(after offset)
Amounts of
financial liabilities
presented in the
balance sheet
(after offset)
2015/12/31 39,891,827$ 46,830,179)($ 39,011,601)($ 880,226$ 7,818,578)($
2014/12/31 44,076,377 55,537,981)( 44,076,377)( - 11,461,604)(
Offsetting trade receivables, notes payable, trade payables and other payables - accrued expenses
Allowance for
Cost
valuation loss Book value
Raw materials 41,033,831$ 3,287,532)($ 37,746,299$
Work in process 1,033,044 68,228)( 964,816
Finished goods 1,291,057 92,675)( 1,198,382
Merchandise inventories 1,738,194 450,915)( 1,287,279
Inventories in transit 245,257 - 245,257
45,341,383$ 3,899,350)($ 41,442,033$
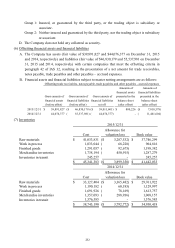
2015/12/31
Allowance for
Cost
valuation loss Book value
Raw materials 33,127,404$ 3,365,482)($ 29,761,922$
Work in process 1,190,182 60,185)( 1,129,997
Finished goods 1,691,926 78,169)( 1,613,757
Merchandise inventories 1,357,093 288,936)( 1,068,157
Inventories in transit 1,376,585 - 1,376,585
38,743,190$ 3,792,772)($ 34,950,418$
2014/12/31