Asus 2015 Annual Report Download - page 123
Download and view the complete annual report
Please find page 123 of the 2015 Asus annual report below. You can navigate through the pages in the report by either clicking on the pages listed below, or by using the keyword search tool below to find specific information within the annual report.-
 1
1 -
2
-
3
-
4
-
5
-
6
-
7
-
8
-
9
-
10
-
11
-
12
-
13
-
14
-
15
-
16
-
17
-
18
-
19
-
20
-
21
-
22
-
23
-
24
-
25
-
26
-
27
-
28
-
29
-
30
-
31
-
32
-
33
-
34
-
35
-
36
-
37
-
38
-
39
-
40
-
41
-
42
-
43
-
44
-
45
-
46
-
47
-
48
-
49
-
50
-
51
-
52
-
53
-
54
-
55
-
56
-
57
-
58
-
59
-
60
-
61
-
62
-
63
-
64
-
65
-
66
-
67
-
68
-
69
-
70
-
71
-
72
-
73
-
74
-
75
-
76
-
77
-
78
-
79
-
80
-
81
-
82
-
83
-
84
-
85
-
86
-
87
-
88
-
89
-
90
-
91
-
92
-
93
-
94
-
95
-
96
-
97
-
98
-
99
-
100
-
101
-
102
-
103
-
104
-
105
-
106
-
107
-
108
-
109
-
110
-
111
-
112
-
 113
113 -
 114
114 -
 115
115 -
 116
116 -
 117
117 -
 118
118 -
 119
119 -
 120
120 -
 121
121 -
 122
122 -
 123
123 -
 124
124 -
 125
125 -
 126
126 -
 127
127 -
 128
128 -
 129
129 -
 130
130 -
 131
131 -
 132
132 -
 133
133 -
134
-
135
-
136
-
137
-
138
-
139
-
140
-
141
-
142
-
143
-
144
-
145
-
146
-
147
-
148
-
149
-
150
-
151
-
152
-
153
-
154
-
155
-
156
-
157
-
158
-
159
-
160
-
161
-
162
-
163
-
164
-
165
-
166
-
167
-
168
-
169
-
170
-
171
-
172
-
173
-
174
-
175
-
176
-
177
-
178
-
179
-
180
-
181
-
182
-
183
-
184
-
185
-
186
-
187
-
188
-
189
-
190
-
191
-
192
-
193
-
194
-
195
-
196
-
197
-
198
-
199
-
200
-
201
-
202
-
203
-
204
-
205
-
206
-
207
-
208
-
209
-
210
-
211
-
212
-
213
-
214
-
215
-
216
-
217
-
218
-
219
-
220
-
221
-
222
-
223
-
224
-
225
-
226
-
227
-
228
-
229
-
230
-
231
-
232
-
233
-
234
-
235
-
236
-
237
-
238
-
239
-
240
-
241
-
242
-
243
-
244
-
245
-
246
-
247
-
248
-
249
-
250
-
251
-
252
-
253
-
254
-
255
-
256
-
257
-
258
-
259
-
260
-
261
-
262
-
263
-
264
-
265
-
266
-
267
-
268
-
269
-
270
-
271
-
272
-
273
-
274
-
275
-
276
-
277
-
278
-
279
 |
 |

119
!
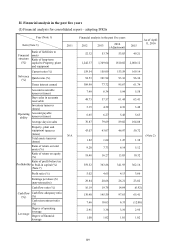
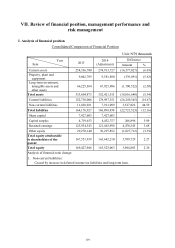
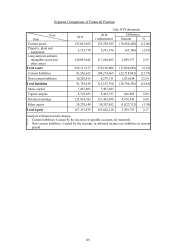
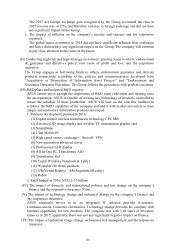
VII. Review of financial position, management performance and
risk management
I. Analysis of financial position
Consolidated Comparison of Financial Position
Unit: NT$ thousands
Year
Item 2015 2014
(Adjustment)
Difference
Amount %
Current assets 258,336,700 274,913,727 (16,577,027) (6.03)
Property, plant and
equipment 9,042,789 9,581,880 (539,091) (5.63)
Long-term investment,
intangible assets and
other assets
66,225,384 67,925,906 (1,700,522) (2.50)
Total assets 333,604,873 352,421,513 (18,816,640) (5.34)
Current liabilities 152,738,006 178,987,351 (26,249,345) (14.67)
Non-current liabilities 11,438,921 7,911,099 3,527,822 44.59
Total liabilities 164,176,927 186,898,450 (22,721,523) (12.16)
Share capital 7,427,603 7,427,603 - -
Capital surplus 4,719,653 4,452,757 266,896 5.99
Retained earnings 125,934,543 121,463,998 4,470,545 3.68
Other equity 29,270,140 30,297,852 (1,027,712) (3.39)
Total equity attributable
to shareholders of the
parent
167,351,939 163,642,210 3,709,729 2.27
Total equity 169,427,946 165,523,063 3,904,883 2.36
Analysis of financial ratio change:
1. Non-current liabilities:
Caused by increase in deferred income tax liabilities and long-term loan.