Asus 2015 Annual Report Download - page 128
Download and view the complete annual report
Please find page 128 of the 2015 Asus annual report below. You can navigate through the pages in the report by either clicking on the pages listed below, or by using the keyword search tool below to find specific information within the annual report.-
 1
1 -
2
-
3
-
4
-
5
-
6
-
7
-
8
-
9
-
10
-
11
-
12
-
13
-
14
-
15
-
16
-
17
-
18
-
19
-
20
-
21
-
22
-
23
-
24
-
25
-
26
-
27
-
28
-
29
-
30
-
31
-
32
-
33
-
34
-
35
-
36
-
37
-
38
-
39
-
40
-
41
-
42
-
43
-
44
-
45
-
46
-
47
-
48
-
49
-
50
-
51
-
52
-
53
-
54
-
55
-
56
-
57
-
58
-
59
-
60
-
61
-
62
-
63
-
64
-
65
-
66
-
67
-
68
-
69
-
70
-
71
-
72
-
73
-
74
-
75
-
76
-
77
-
78
-
79
-
80
-
81
-
82
-
83
-
84
-
85
-
86
-
87
-
88
-
89
-
90
-
91
-
92
-
93
-
94
-
95
-
96
-
97
-
98
-
99
-
100
-
101
-
102
-
103
-
104
-
105
-
106
-
107
-
108
-
109
-
110
-
111
-
112
-
113
-
114
-
115
-
116
-
117
-
 118
118 -
 119
119 -
 120
120 -
 121
121 -
 122
122 -
 123
123 -
 124
124 -
 125
125 -
 126
126 -
 127
127 -
 128
128 -
 129
129 -
 130
130 -
 131
131 -
 132
132 -
 133
133 -
 134
134 -
 135
135 -
 136
136 -
 137
137 -
 138
138 -
139
-
140
-
141
-
142
-
143
-
144
-
145
-
146
-
147
-
148
-
149
-
150
-
151
-
152
-
153
-
154
-
155
-
156
-
157
-
158
-
159
-
160
-
161
-
162
-
163
-
164
-
165
-
166
-
167
-
168
-
169
-
170
-
171
-
172
-
173
-
174
-
175
-
176
-
177
-
178
-
179
-
180
-
181
-
182
-
183
-
184
-
185
-
186
-
187
-
188
-
189
-
190
-
191
-
192
-
193
-
194
-
195
-
196
-
197
-
198
-
199
-
200
-
201
-
202
-
203
-
204
-
205
-
206
-
207
-
208
-
209
-
210
-
211
-
212
-
213
-
214
-
215
-
216
-
217
-
218
-
219
-
220
-
221
-
222
-
223
-
224
-
225
-
226
-
227
-
228
-
229
-
230
-
231
-
232
-
233
-
234
-
235
-
236
-
237
-
238
-
239
-
240
-
241
-
242
-
243
-
244
-
245
-
246
-
247
-
248
-
249
-
250
-
251
-
252
-
253
-
254
-
255
-
256
-
257
-
258
-
259
-
260
-
261
-
262
-
263
-
264
-
265
-
266
-
267
-
268
-
269
-
270
-
271
-
272
-
273
-
274
-
275
-
276
-
277
-
278
-
279
 |
 |
124
124
!
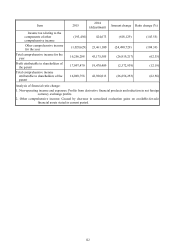
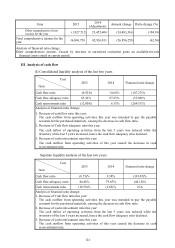
Item 2015 2014
(Adjustment) Amount change Ratio change (%)
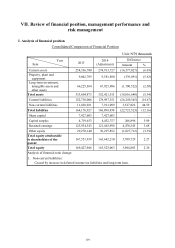
Other comprehensive (loss)
income for the year (1,027,712) 23,455,604 (24,483,316) (104.38)
Total comprehensive income for the
year 16,069,758 42,926,013 (26,856,255) (62.56)
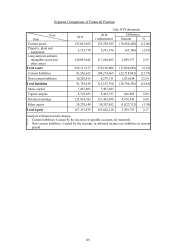
Analysis of financial ratio change:
Other comprehensive income: Caused by decrease in unrealized evaluation gains on available-for-sale
financial assets stated in current period.
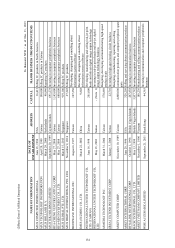
III. Analysis of cash flow
(I) Consolidated liquidity analysis of the last two years
Year
Item
2015 2014 Financial ratio change
Cash flow ratio (6.92)% 14.64% (147.27)%
Cash flow adequacy ratio 65.41% 97.63% (33.00)%
Cash reinvestment ratio (12.00)% 6.33% (289.57)%
Analysis of financial ratio change:
1. Decrease of cash flow ratio this year:
The cash outflow from operating activities this year was intended to pay the payable
accounts for the purchased materials, causing the decrease in cash flow ratio.
2. Decrease of Cash flow adequacy ratio this year:
The cash inflow of operating activities from the last 5 years was reduced while the
inventory of the last 5 years increased, hence the cash flow adequacy ratio declined.
3. Decrease of cash reinvestment ratio this year:
The cash outflow from operating activities of this year caused the decrease in cash
re-investment ratio.
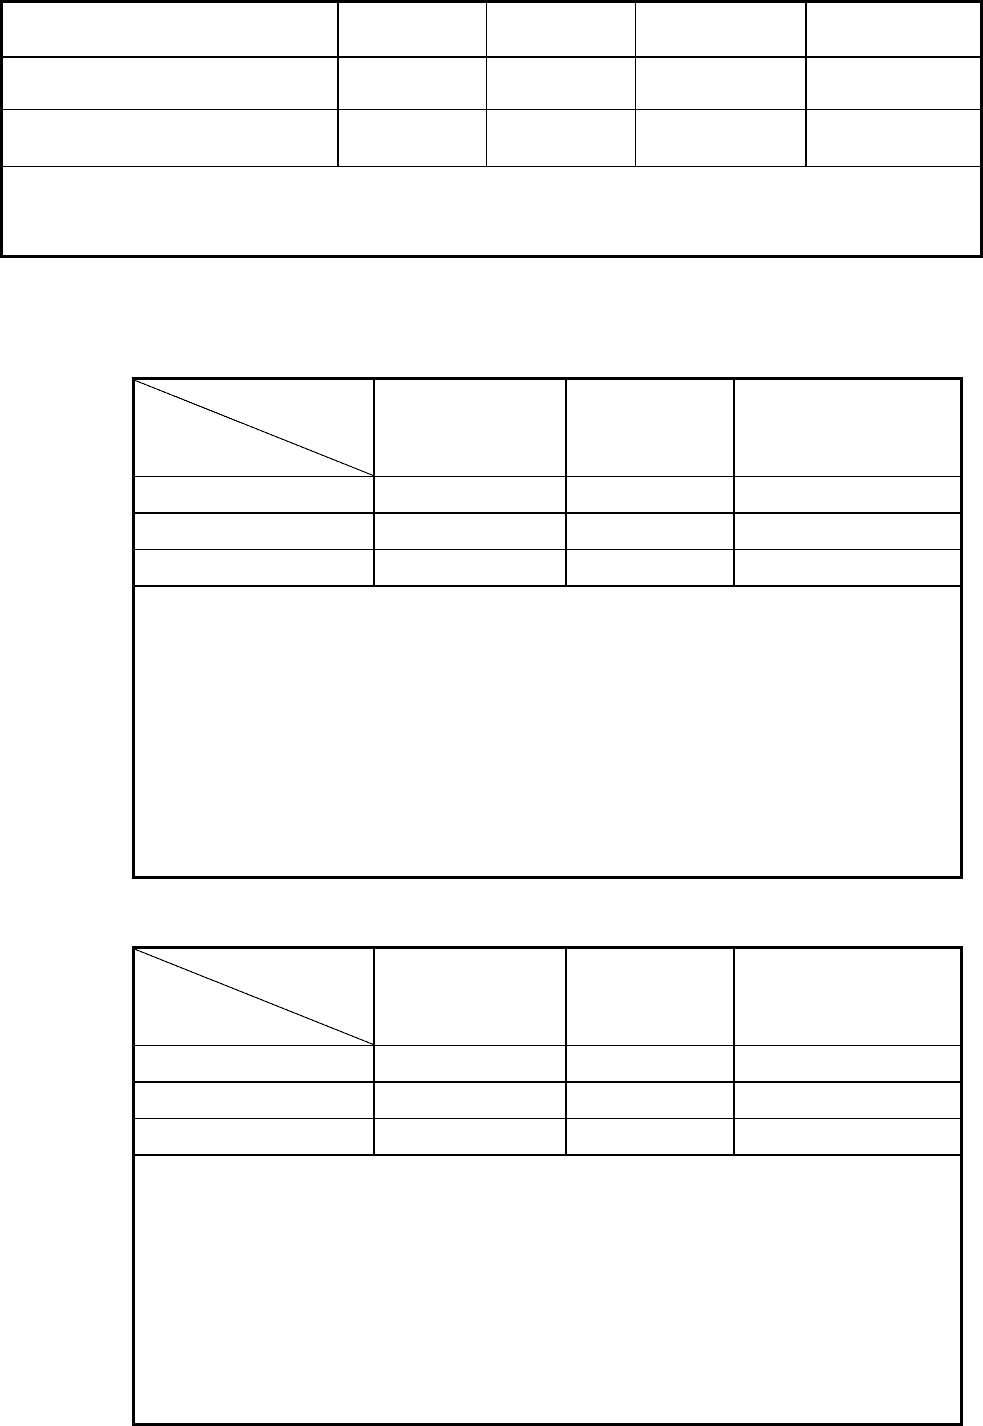
Separate liquidity analysis of the last two years
Year
Item
2015 2014 Financial ratio change
Cash flow ratio (8.73)% 9.38% (193.07)%
Cash flow adequacy ratio 44.46% 79.65% (44.18)%
Cash reinvestment ratio (10.78)% (2.65)% N/A
Analysis of financial ratio change:
1. Decrease of Cash flow ratio this year:
The cash outflow from operating activities this year was intended to pay the payable
accounts for the purchased materials, causing the decrease in cash flow ratio.
2. Decrease of cash reinvestment ratio this year:
The cash inflow of operating activities from the last 5 years was reduced while the
inventory of the last 5 years increased, hence the cash flow adequacy ratio declined.
3. Decrease of cash reinvestment ratio this year:
The cash outflow from operating activities of this year caused the decrease in cash
re-investment ratio.