Asus 2015 Annual Report Download - page 237
Download and view the complete annual report
Please find page 237 of the 2015 Asus annual report below. You can navigate through the pages in the report by either clicking on the pages listed below, or by using the keyword search tool below to find specific information within the annual report.-
 1
1 -
2
-
3
-
4
-
5
-
6
-
7
-
8
-
9
-
10
-
11
-
12
-
13
-
14
-
15
-
16
-
17
-
18
-
19
-
20
-
21
-
22
-
23
-
24
-
25
-
26
-
27
-
28
-
29
-
30
-
31
-
32
-
33
-
34
-
35
-
36
-
37
-
38
-
39
-
40
-
41
-
42
-
43
-
44
-
45
-
46
-
47
-
48
-
49
-
50
-
51
-
52
-
53
-
54
-
55
-
56
-
57
-
58
-
59
-
60
-
61
-
62
-
63
-
64
-
65
-
66
-
67
-
68
-
69
-
70
-
71
-
72
-
73
-
74
-
75
-
76
-
77
-
78
-
79
-
80
-
81
-
82
-
83
-
84
-
85
-
86
-
87
-
88
-
89
-
90
-
91
-
92
-
93
-
94
-
95
-
96
-
97
-
98
-
99
-
100
-
101
-
102
-
103
-
104
-
105
-
106
-
107
-
108
-
109
-
110
-
111
-
112
-
113
-
114
-
115
-
116
-
117
-
118
-
119
-
120
-
121
-
122
-
123
-
124
-
125
-
126
-
127
-
128
-
129
-
130
-
131
-
132
-
133
-
134
-
135
-
136
-
137
-
138
-
139
-
140
-
141
-
142
-
143
-
144
-
145
-
146
-
147
-
148
-
149
-
150
-
151
-
152
-
153
-
154
-
155
-
156
-
157
-
158
-
159
-
160
-
161
-
162
-
163
-
164
-
165
-
166
-
167
-
168
-
169
-
170
-
171
-
172
-
173
-
174
-
175
-
176
-
177
-
178
-
179
-
180
-
181
-
182
-
183
-
184
-
185
-
186
-
187
-
188
-
189
-
190
-
191
-
192
-
193
-
194
-
195
-
196
-
197
-
198
-
199
-
200
-
201
-
202
-
203
-
204
-
205
-
206
-
207
-
208
-
209
-
210
-
211
-
212
-
213
-
214
-
215
-
216
-
217
-
218
-
219
-
220
-
221
-
222
-
223
-
224
-
225
-
226
-
 227
227 -
 228
228 -
 229
229 -
 230
230 -
 231
231 -
 232
232 -
 233
233 -
 234
234 -
 235
235 -
 236
236 -
 237
237 -
 238
238 -
 239
239 -
 240
240 -
 241
241 -
 242
242 -
 243
243 -
 244
244 -
 245
245 -
 246
246 -
 247
247 -
248
-
249
-
250
-
251
-
252
-
253
-
254
-
255
-
256
-
257
-
258
-
259
-
260
-
261
-
262
-
263
-
264
-
265
-
266
-
267
-
268
-
269
-
270
-
271
-
272
-
273
-
274
-
275
-
276
-
277
-
278
-
279
 |
 |

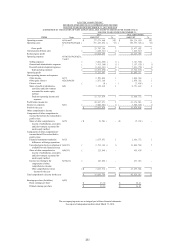
233
ASUSTEK COMPUTER INC.
SEPARATE STATEMENTS OF CASH FLOWS
FOR THE YEARS ENDED DECEMBER 31, 2015 AND 2014
(EXPRESSED IN THOUSANDS OF NEW TAIWAN DOLLARS)
FOR THE YEARS ENDED DECEMBER 31,
2015
2014
(ADJUSTED)
The accompanying notes are an integral part of these financial statements.
See report of independent auditors dated March 17, 2016.
Cash flows from operating activities
Profit before income tax for the year
$
20,997,971
$
23,376,083
Adjustments to reconcile profit before income tax to net cash provided by (used in) operating
activities
Income and expenses that result in non-cash flows
Depreciation
291,727
1,776,698
Amortisation
173,071
134,924
Bad debt provision
26,289
89,955
Net gain on financial assets or liabilities at fair value through profit or loss
(
52,615
)
(
40,276
)
Share of profit of subsidiaries, associates and joint ventures accounted for under equity
method
(
7,352,930
)
(
8,751,499
)
Interest income
(
135,072
)
(
202,518
)
Dividend income
(
2,374,822
)
(
1,691,862
)
Unrealized profit from sales
1,688,741
1,049,817
Others
32,577
37,064
Changes in assets/liabilities relating to operating activities
Financial assets at fair value through profit or loss
(
221,609
)
4,157,431
Trade receivables
(
1,080,633
)
(
2,601,687
)
Trade receivables - related parties
12,334,063
(
20,939,524
)
Other receivables
22,506
9,997
Inventories
(
6,491,615
)
(
9,801,012
)
Prepayments
(
62,522
)
(
653,223
)
Other current assets
17,197
25,427
Financial liabilities at fair value through profit or loss
(
18,163
)
-
Notes and trade payables
(
25,629,896
)
20,759,348
Other payables - accrued expenses
2,390,405
4,377,023
Provisions for liabilities
1,162,217
1,052,902
Other current liabilities
334,485
(
283,935
)
Receipt of interest
141,582
202,519
Payment of interest
(
18
)
(
13,409
)
Payment of income tax
(
3,313,718
)
(
2,284,883
)
Net cash provided by (used in) operating activities
(
7,120,782
)
9,785,360
Cash flows from investing activities
Acquisition of available-for-sale financial assets
(
153,323
)
(
127,262
)
Proceeds from disposal of available-for-sale financial assets
254
114,427
Acquisition of investments accounted for under equity method
(
204,348
)
(
85,290
)
Proceeds from disposal of investments accounted for under equity method
277,289
9
Acquisition of property, plant and equipment
(
222,213
)
(
458,883
)
Acquisition of intangible assets
(
70,325
)
(
167,801
)
Proceeds from capital reduction of investments accounted for under equity method
2,133,042
67,993
Changes in other non-current assets
(
60,281
)
(
106,797
)
Receipt of dividends
2,831,489
2,153,336
Others
(
7,002
)
(
6,738
)
Net cash provided by (used in) investing activities
4,524,582
1,382,994
Cash flows from financing activities
Payment of cash dividends
(
12,626,925
)
(
14,483,825
)
Others
(
4,219
)
11,159
Net cash provided by (used in) financing activities
(
12,631,144
)
(
14,472,666
)
Decrease in cash and cash equivalents
(
15,227,344
)
(
3,304,312
)
Cash and cash equivalents at beginning of year
20,958,509
24,262,821
Cash and cash equivalents at end of year
$
5,731,165
$
20,958,509