Asus 2015 Annual Report Download - page 116
Download and view the complete annual report
Please find page 116 of the 2015 Asus annual report below. You can navigate through the pages in the report by either clicking on the pages listed below, or by using the keyword search tool below to find specific information within the annual report.-
 1
1 -
2
-
3
-
4
-
5
-
6
-
7
-
8
-
9
-
10
-
11
-
12
-
13
-
14
-
15
-
16
-
17
-
18
-
19
-
20
-
21
-
22
-
23
-
24
-
25
-
26
-
27
-
28
-
29
-
30
-
31
-
32
-
33
-
34
-
35
-
36
-
37
-
38
-
39
-
40
-
41
-
42
-
43
-
44
-
45
-
46
-
47
-
48
-
49
-
50
-
51
-
52
-
53
-
54
-
55
-
56
-
57
-
58
-
59
-
60
-
61
-
62
-
63
-
64
-
65
-
66
-
67
-
68
-
69
-
70
-
71
-
72
-
73
-
74
-
75
-
76
-
77
-
78
-
79
-
80
-
81
-
82
-
83
-
84
-
85
-
86
-
87
-
88
-
89
-
90
-
91
-
92
-
93
-
94
-
95
-
96
-
97
-
98
-
99
-
100
-
101
-
102
-
103
-
104
-
105
-
 106
106 -
 107
107 -
 108
108 -
 109
109 -
 110
110 -
 111
111 -
 112
112 -
 113
113 -
 114
114 -
 115
115 -
 116
116 -
 117
117 -
 118
118 -
 119
119 -
 120
120 -
 121
121 -
 122
122 -
 123
123 -
 124
124 -
 125
125 -
 126
126 -
127
-
128
-
129
-
130
-
131
-
132
-
133
-
134
-
135
-
136
-
137
-
138
-
139
-
140
-
141
-
142
-
143
-
144
-
145
-
146
-
147
-
148
-
149
-
150
-
151
-
152
-
153
-
154
-
155
-
156
-
157
-
158
-
159
-
160
-
161
-
162
-
163
-
164
-
165
-
166
-
167
-
168
-
169
-
170
-
171
-
172
-
173
-
174
-
175
-
176
-
177
-
178
-
179
-
180
-
181
-
182
-
183
-
184
-
185
-
186
-
187
-
188
-
189
-
190
-
191
-
192
-
193
-
194
-
195
-
196
-
197
-
198
-
199
-
200
-
201
-
202
-
203
-
204
-
205
-
206
-
207
-
208
-
209
-
210
-
211
-
212
-
213
-
214
-
215
-
216
-
217
-
218
-
219
-
220
-
221
-
222
-
223
-
224
-
225
-
226
-
227
-
228
-
229
-
230
-
231
-
232
-
233
-
234
-
235
-
236
-
237
-
238
-
239
-
240
-
241
-
242
-
243
-
244
-
245
-
246
-
247
-
248
-
249
-
250
-
251
-
252
-
253
-
254
-
255
-
256
-
257
-
258
-
259
-
260
-
261
-
262
-
263
-
264
-
265
-
266
-
267
-
268
-
269
-
270
-
271
-
272
-
273
-
274
-
275
-
276
-
277
-
278
-
279
 |
 |
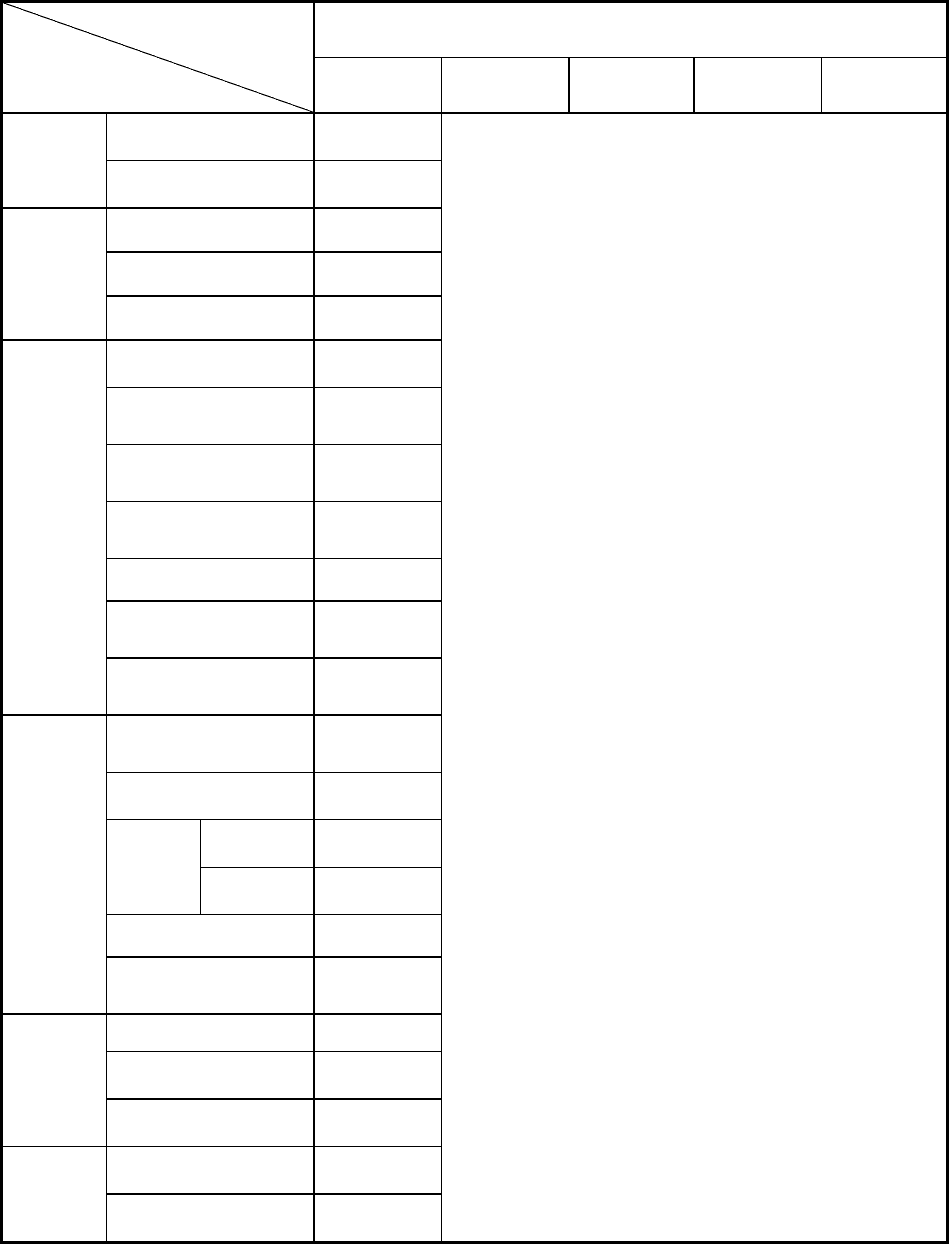
112
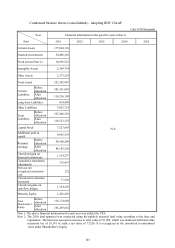
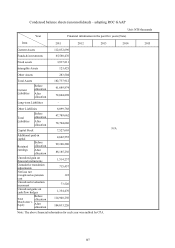
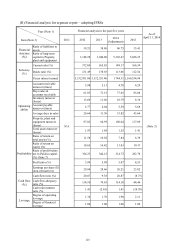
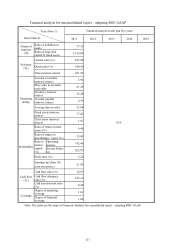
Financial analysis for consolidated report – adopting ROC GAAP
Year (Note 1)
Item (Note 2)
Financial analysis in the past five years
2011 2012 2013 2014 2015
Financial
structure
(ʘ)
Ratio of liabilities to
assets 47.99
N/A
Ratio of long-term
capital to fixed assets 1,113.36
Solvency
(ʘ)
Current ratio (%) 171.93
Quick ratio (%) 109.73
Times interest earned 157.13
Operating
ability
Account receivable
turnover (times) 7.99
Days sales in accounts
receivable 45.68
Inventory turnover
(times) 5.95
Account payable
turnover (times) 6.40
Average days in sales 61.34
Fixed assets turnover
(times) 38.82
Total assets turnover
(times) 1.84
Profitability
Ratio of return on total
assets (%) 8.10
Ratio of return on
shareholders’ equity (%) 15.14
Ratio to
paid-in
capital (%)
Operating
income 242.17
Income
before tax 267.47
Profit ratio (%) 4.39
Earnings per share ($)
(non-retroactive) 21.99
Cash flow
(ʘ)
Cash flow ratio (%) 17.88
Cash flow adequacy
ratio (%) 157.00
Cash reinvestment ratio
(%) 7.80
Leverage
Degree of operating
leverage 3.08
Degree of financial
leverage 1.01
Note 1: The financial information is audited by CPA.
Note 2: Equations:
1. Financial structure
(1) Ratio of liabilities to assets = Total liability/Total assets