Asus 2015 Annual Report Download - page 195
Download and view the complete annual report
Please find page 195 of the 2015 Asus annual report below. You can navigate through the pages in the report by either clicking on the pages listed below, or by using the keyword search tool below to find specific information within the annual report.-
 1
1 -
2
-
3
-
4
-
5
-
6
-
7
-
8
-
9
-
10
-
11
-
12
-
13
-
14
-
15
-
16
-
17
-
18
-
19
-
20
-
21
-
22
-
23
-
24
-
25
-
26
-
27
-
28
-
29
-
30
-
31
-
32
-
33
-
34
-
35
-
36
-
37
-
38
-
39
-
40
-
41
-
42
-
43
-
44
-
45
-
46
-
47
-
48
-
49
-
50
-
51
-
52
-
53
-
54
-
55
-
56
-
57
-
58
-
59
-
60
-
61
-
62
-
63
-
64
-
65
-
66
-
67
-
68
-
69
-
70
-
71
-
72
-
73
-
74
-
75
-
76
-
77
-
78
-
79
-
80
-
81
-
82
-
83
-
84
-
85
-
86
-
87
-
88
-
89
-
90
-
91
-
92
-
93
-
94
-
95
-
96
-
97
-
98
-
99
-
100
-
101
-
102
-
103
-
104
-
105
-
106
-
107
-
108
-
109
-
110
-
111
-
112
-
113
-
114
-
115
-
116
-
117
-
118
-
119
-
120
-
121
-
122
-
123
-
124
-
125
-
126
-
127
-
128
-
129
-
130
-
131
-
132
-
133
-
134
-
135
-
136
-
137
-
138
-
139
-
140
-
141
-
142
-
143
-
144
-
145
-
146
-
147
-
148
-
149
-
150
-
151
-
152
-
153
-
154
-
155
-
156
-
157
-
158
-
159
-
160
-
161
-
162
-
163
-
164
-
165
-
166
-
167
-
168
-
169
-
170
-
171
-
172
-
173
-
174
-
175
-
176
-
177
-
178
-
179
-
180
-
181
-
182
-
183
-
184
-
 185
185 -
 186
186 -
 187
187 -
 188
188 -
 189
189 -
 190
190 -
 191
191 -
 192
192 -
 193
193 -
 194
194 -
 195
195 -
 196
196 -
 197
197 -
 198
198 -
 199
199 -
 200
200 -
 201
201 -
 202
202 -
 203
203 -
 204
204 -
 205
205 -
206
-
207
-
208
-
209
-
210
-
211
-
212
-
213
-
214
-
215
-
216
-
217
-
218
-
219
-
220
-
221
-
222
-
223
-
224
-
225
-
226
-
227
-
228
-
229
-
230
-
231
-
232
-
233
-
234
-
235
-
236
-
237
-
238
-
239
-
240
-
241
-
242
-
243
-
244
-
245
-
246
-
247
-
248
-
249
-
250
-
251
-
252
-
253
-
254
-
255
-
256
-
257
-
258
-
259
-
260
-
261
-
262
-
263
-
264
-
265
-
266
-
267
-
268
-
269
-
270
-
271
-
272
-
273
-
274
-
275
-
276
-
277
-
278
-
279
 |
 |

191
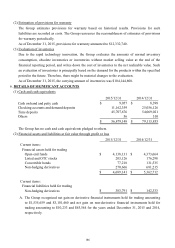
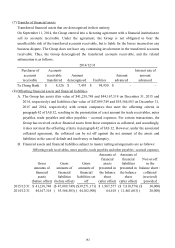
B. Individual assessment of impaired trade receivables:
(A) Impaired but not past due
(B) Impaired and past due
(C) Movements for allowance for doubtful accounts (accumulated impairment) of trade
receivables are as follows:
C. The credit quality of trade receivables that are neither past due nor impaired based on the
Group’s Credit Quality Control Policy is as follows:
Group 1:
Insured, or guaranteed by the third party, or the trading object is the associate.
Group 2:
Neither insured and guaranteed by the third party, nor the trading object is the
associate.
2015/12/31 2014/12/31
Gross amount 659$ 4,309$
2015/12/31 2014/12/31
Gross amount 2,946,914$ 2,773,876$
Individual provision Group provision Total
January 1 1,951,749$ 826,436$ 2,778,185$
Recognition (reversal) 47,045 117,136 164,181
Write-offs 785)( 83,732)( 84,517)(
Net exchange differences 68,832 20,892 89,724
December 31 2,066,841$ 880,732$ 2,947,573$
2015
Individual provision Group provision Total
January 1 1,844,756$ 583,419$ 2,428,175$
Recognition (reversal) 109,221 158,404 267,625
Write-offs 17,910)( 46,660)( 64,570)(
Reclassifications 90,189)( 90,189 -
Net exchange differences 108,556 41,084 149,640
Effect due to changes in 2,685)( - 2,685)(
consolidated entities
December 31 1,951,749$ 826,436$ 2,778,185$
2014
2015/12/31 2014/12/31
Group 1 33,057,736$ 34,629,000$
Group 2 29,266,293 28,210,123
62,324,029$ 62,839,123$