Asus 2015 Annual Report Download - page 213
Download and view the complete annual report
Please find page 213 of the 2015 Asus annual report below. You can navigate through the pages in the report by either clicking on the pages listed below, or by using the keyword search tool below to find specific information within the annual report.-
 1
1 -
2
-
3
-
4
-
5
-
6
-
7
-
8
-
9
-
10
-
11
-
12
-
13
-
14
-
15
-
16
-
17
-
18
-
19
-
20
-
21
-
22
-
23
-
24
-
25
-
26
-
27
-
28
-
29
-
30
-
31
-
32
-
33
-
34
-
35
-
36
-
37
-
38
-
39
-
40
-
41
-
42
-
43
-
44
-
45
-
46
-
47
-
48
-
49
-
50
-
51
-
52
-
53
-
54
-
55
-
56
-
57
-
58
-
59
-
60
-
61
-
62
-
63
-
64
-
65
-
66
-
67
-
68
-
69
-
70
-
71
-
72
-
73
-
74
-
75
-
76
-
77
-
78
-
79
-
80
-
81
-
82
-
83
-
84
-
85
-
86
-
87
-
88
-
89
-
90
-
91
-
92
-
93
-
94
-
95
-
96
-
97
-
98
-
99
-
100
-
101
-
102
-
103
-
104
-
105
-
106
-
107
-
108
-
109
-
110
-
111
-
112
-
113
-
114
-
115
-
116
-
117
-
118
-
119
-
120
-
121
-
122
-
123
-
124
-
125
-
126
-
127
-
128
-
129
-
130
-
131
-
132
-
133
-
134
-
135
-
136
-
137
-
138
-
139
-
140
-
141
-
142
-
143
-
144
-
145
-
146
-
147
-
148
-
149
-
150
-
151
-
152
-
153
-
154
-
155
-
156
-
157
-
158
-
159
-
160
-
161
-
162
-
163
-
164
-
165
-
166
-
167
-
168
-
169
-
170
-
171
-
172
-
173
-
174
-
175
-
176
-
177
-
178
-
179
-
180
-
181
-
182
-
183
-
184
-
185
-
186
-
187
-
188
-
189
-
190
-
191
-
192
-
193
-
194
-
195
-
196
-
197
-
198
-
199
-
200
-
201
-
202
-
 203
203 -
 204
204 -
 205
205 -
 206
206 -
 207
207 -
 208
208 -
 209
209 -
 210
210 -
 211
211 -
 212
212 -
 213
213 -
 214
214 -
 215
215 -
 216
216 -
 217
217 -
 218
218 -
 219
219 -
 220
220 -
 221
221 -
 222
222 -
 223
223 -
224
-
225
-
226
-
227
-
228
-
229
-
230
-
231
-
232
-
233
-
234
-
235
-
236
-
237
-
238
-
239
-
240
-
241
-
242
-
243
-
244
-
245
-
246
-
247
-
248
-
249
-
250
-
251
-
252
-
253
-
254
-
255
-
256
-
257
-
258
-
259
-
260
-
261
-
262
-
263
-
264
-
265
-
266
-
267
-
268
-
269
-
270
-
271
-
272
-
273
-
274
-
275
-
276
-
277
-
278
-
279
 |
 |

209
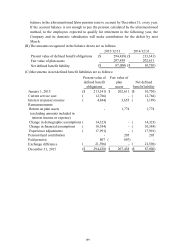
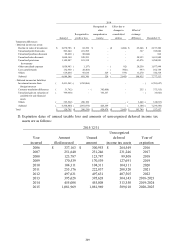
D. Expiration dates of unused taxable loss and amounts of unrecognized deferred income tax
assets are as follows:
Recognized in Effect due to
other changes in Effect of
Recognized in comprehensive consolidated exchange
January 1 profit or loss income entities difference December 31
Temporary differences:
- Deferred income tax assets:
Decline in value of inventories 2,070,786$ 62,352$ -$ 1,484)($ 65,646$ 2,197,300$
Unrealized profit from sales 503,644 221,595 - - 367 725,606
Unrealized purchase discounts 89,460 88,644)( - - - 816
Unrealized sales discounts 1,064,364 528,553 - - 58,923 1,651,840
Unrealized provisions 1,149,887 101,518 - - 43,476 1,294,881
for warranty
Other unrealized expenses 1,058,983 1,157)( - 82)( 20,250 1,077,994
Loss carryforwards 132,960 28,505)( - 700)( 997)( 102,758
Others 619,464 95,634 329 379)( 11,270 726,318
Subtotal 6,689,548 891,346 329 2,645)( 198,935 7,777,513
- Deferred income tax liabilities:
Investment income from 5,411,561)( 1,292,066)( - - - 6,703,627)(
foreign investees
Currency translation differences 31,762)( - 342,008)( - 255 373,515)(
Unrealized gain on valuation of 799,958)( - 766,357 - - 33,601)(
available-for-sale financial
assets
Others 325,562)( 200,190 - - 3,441)( 128,813)(
Subtotal 6,568,843)( 1,091,876)( 424,349 - 3,186)( 7,239,556)(
Total 120,705$ 200,530)($ 424,678$ 2,645)($ 195,749$ 537,957$
2014
Year
incurred
Amount
filed/assessed
Unused
amount
Unrecognized
deferred
income tax assets
Year of
expiration
2006 337,163$ 300,953$ 264,549$ 2016
2007 251,640 231,246 231,246 2017
2008 123,787 123,787 99,508 2018
2009 170,539 170,539 127,691 2019
2010 104,311 104,311 104,311 2020
2011 255,176 222,837 208,320 2021
2012 497,631 497,631 407,505 2022
2013 395,628 395,628 304,143 2018-2023
2014 455,008 455,008 313,350 2019-2024
2015 1,081,969 1,081,969 589,018 2020-2025
2015/12/31