Asus 2015 Annual Report Download - page 114
Download and view the complete annual report
Please find page 114 of the 2015 Asus annual report below. You can navigate through the pages in the report by either clicking on the pages listed below, or by using the keyword search tool below to find specific information within the annual report.-
 1
1 -
2
-
3
-
4
-
5
-
6
-
7
-
8
-
9
-
10
-
11
-
12
-
13
-
14
-
15
-
16
-
17
-
18
-
19
-
20
-
21
-
22
-
23
-
24
-
25
-
26
-
27
-
28
-
29
-
30
-
31
-
32
-
33
-
34
-
35
-
36
-
37
-
38
-
39
-
40
-
41
-
42
-
43
-
44
-
45
-
46
-
47
-
48
-
49
-
50
-
51
-
52
-
53
-
54
-
55
-
56
-
57
-
58
-
59
-
60
-
61
-
62
-
63
-
64
-
65
-
66
-
67
-
68
-
69
-
70
-
71
-
72
-
73
-
74
-
75
-
76
-
77
-
78
-
79
-
80
-
81
-
82
-
83
-
84
-
85
-
86
-
87
-
88
-
89
-
90
-
91
-
92
-
93
-
94
-
95
-
96
-
97
-
98
-
99
-
100
-
101
-
102
-
103
-
 104
104 -
 105
105 -
 106
106 -
 107
107 -
 108
108 -
 109
109 -
 110
110 -
 111
111 -
 112
112 -
 113
113 -
 114
114 -
 115
115 -
 116
116 -
 117
117 -
 118
118 -
 119
119 -
 120
120 -
 121
121 -
 122
122 -
 123
123 -
 124
124 -
125
-
126
-
127
-
128
-
129
-
130
-
131
-
132
-
133
-
134
-
135
-
136
-
137
-
138
-
139
-
140
-
141
-
142
-
143
-
144
-
145
-
146
-
147
-
148
-
149
-
150
-
151
-
152
-
153
-
154
-
155
-
156
-
157
-
158
-
159
-
160
-
161
-
162
-
163
-
164
-
165
-
166
-
167
-
168
-
169
-
170
-
171
-
172
-
173
-
174
-
175
-
176
-
177
-
178
-
179
-
180
-
181
-
182
-
183
-
184
-
185
-
186
-
187
-
188
-
189
-
190
-
191
-
192
-
193
-
194
-
195
-
196
-
197
-
198
-
199
-
200
-
201
-
202
-
203
-
204
-
205
-
206
-
207
-
208
-
209
-
210
-
211
-
212
-
213
-
214
-
215
-
216
-
217
-
218
-
219
-
220
-
221
-
222
-
223
-
224
-
225
-
226
-
227
-
228
-
229
-
230
-
231
-
232
-
233
-
234
-
235
-
236
-
237
-
238
-
239
-
240
-
241
-
242
-
243
-
244
-
245
-
246
-
247
-
248
-
249
-
250
-
251
-
252
-
253
-
254
-
255
-
256
-
257
-
258
-
259
-
260
-
261
-
262
-
263
-
264
-
265
-
266
-
267
-
268
-
269
-
270
-
271
-
272
-
273
-
274
-
275
-
276
-
277
-
278
-
279
 |
 |

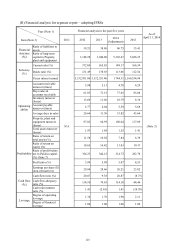
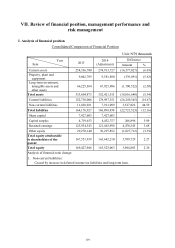
110
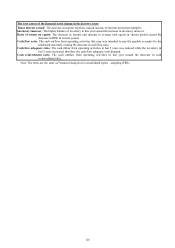
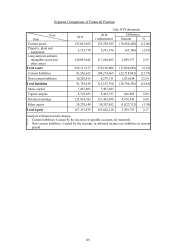
The root causes of the financial ratio change in the last two years:
Times interest earned: The current average total asset amount increased, causing the current return on assets to
decrease.
Ratio of return on equity: The decrease in the income in current period was a result of the decrease in ROE in current
period.
Cash flow ratio: The cash outflow from operating activities this year was intended to pay the payable accounts for the
purchased materials, causing the decrease in cash flow ratio.
Cash flow adequacy ratio: The cash inflow from operating activities in last 5 years was reduced while the inventory in
last 5 years increased, therefore the cash flow adequacy ratio dropped.
Cash reinvestment ratio: The cash outflow from operating activities of this year caused the decrease in cash
re-investment ratio.
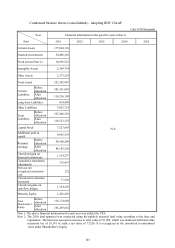
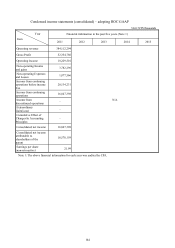
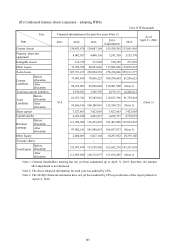
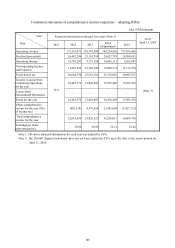
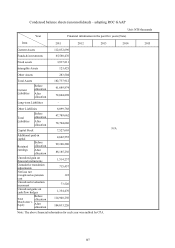
Note 1: The financial information is audited by CPA.
Note 2: The 2016Q1 financial statements have not yet been audited by CPA up to the date of the report printed on
April 11, 2016.
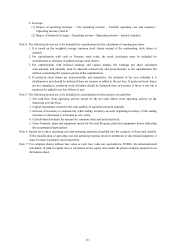
Note 3: Equations:
1. Financial structure
(1) Ratio of liabilities to assets = Total liabilities / Total assets
(2) Ratio of long-term capital to property, plant and equipment = (Total equity + non-current liabilities) /
Net property, plant and equipment
2. Solvency
(1) Current ratio = Current assets / Current liabilities
(2) Quick ratio = (Current assets – Inventory – Prepaid expenses) / Current liabilities
(3) Times interest earned = Net income before tax and interest expense / Interest expense of the year
3. Operating ability
(2) Account receivable turnover (including accounts receivable and notes receivable derived from
business operation) = Net sales / Average accounts receivable (including accounts receivable and notes
receivable derived from business operation)
(3) Days sales in accounts receivable = 365 / Account receivable turnover
(4) Inventory turnover = Cost of goods sold / Average inventory amount
(5) Account payable turnover (including accounts payable and notes payable derived from business
operation) = Cost of goods sold/ Average accounts payable (including accounts payable and notes
payable derived from business operation)
(6) Average days in sales = 365 / Inventory turnover
(7) Property, plant and equipment turnover = Net sales / Average net property, plant and equipment
(8) Total assets turnover = Net sales / Average total assets
4. Profitability
(1) Ratio of return on total assets = [Net income (loss) + interest expense x (1-tax rate)] / Average total
assets
(2) Ratio of return on equity = Net income (loss) / Net average total equity
(3) Ratio of profit before tax to paid-in capital = Net income before tax / Paid-in capital
(4) Profit ratio = Net income (loss) / Net sales
(5) Earnings per share = (Profit attributable to shareholders of the parent – preferred stock dividend) /
Weighted average stock shares issued (Note 4)
5. Cash flow
(1) Cash flow ratio = Net cash flow from operating activity / Current liabilities
(2) Cash flow adequacy ratio = Net cash flow from operating activity in the past five years / (Capital
expenditure + Inventory increase + Cash dividend) in the past five years
(3) Cash reinvestment ratio = (Net cash flow from operating activity – Cash dividend) / (Gross property,
plant and equipment + Long-term investment + Other non-current assets + Working capital) (Note 5)