Asus 2015 Annual Report Download - page 273
Download and view the complete annual report
Please find page 273 of the 2015 Asus annual report below. You can navigate through the pages in the report by either clicking on the pages listed below, or by using the keyword search tool below to find specific information within the annual report.-
 1
1 -
2
-
3
-
4
-
5
-
6
-
7
-
8
-
9
-
10
-
11
-
12
-
13
-
14
-
15
-
16
-
17
-
18
-
19
-
20
-
21
-
22
-
23
-
24
-
25
-
26
-
27
-
28
-
29
-
30
-
31
-
32
-
33
-
34
-
35
-
36
-
37
-
38
-
39
-
40
-
41
-
42
-
43
-
44
-
45
-
46
-
47
-
48
-
49
-
50
-
51
-
52
-
53
-
54
-
55
-
56
-
57
-
58
-
59
-
60
-
61
-
62
-
63
-
64
-
65
-
66
-
67
-
68
-
69
-
70
-
71
-
72
-
73
-
74
-
75
-
76
-
77
-
78
-
79
-
80
-
81
-
82
-
83
-
84
-
85
-
86
-
87
-
88
-
89
-
90
-
91
-
92
-
93
-
94
-
95
-
96
-
97
-
98
-
99
-
100
-
101
-
102
-
103
-
104
-
105
-
106
-
107
-
108
-
109
-
110
-
111
-
112
-
113
-
114
-
115
-
116
-
117
-
118
-
119
-
120
-
121
-
122
-
123
-
124
-
125
-
126
-
127
-
128
-
129
-
130
-
131
-
132
-
133
-
134
-
135
-
136
-
137
-
138
-
139
-
140
-
141
-
142
-
143
-
144
-
145
-
146
-
147
-
148
-
149
-
150
-
151
-
152
-
153
-
154
-
155
-
156
-
157
-
158
-
159
-
160
-
161
-
162
-
163
-
164
-
165
-
166
-
167
-
168
-
169
-
170
-
171
-
172
-
173
-
174
-
175
-
176
-
177
-
178
-
179
-
180
-
181
-
182
-
183
-
184
-
185
-
186
-
187
-
188
-
189
-
190
-
191
-
192
-
193
-
194
-
195
-
196
-
197
-
198
-
199
-
200
-
201
-
202
-
203
-
204
-
205
-
206
-
207
-
208
-
209
-
210
-
211
-
212
-
213
-
214
-
215
-
216
-
217
-
218
-
219
-
220
-
221
-
222
-
223
-
224
-
225
-
226
-
227
-
228
-
229
-
230
-
231
-
232
-
233
-
234
-
235
-
236
-
237
-
238
-
239
-
240
-
241
-
242
-
243
-
244
-
245
-
246
-
247
-
248
-
249
-
250
-
251
-
252
-
253
-
254
-
255
-
256
-
257
-
258
-
259
-
260
-
261
-
262
-
 263
263 -
 264
264 -
 265
265 -
 266
266 -
 267
267 -
 268
268 -
 269
269 -
 270
270 -
 271
271 -
 272
272 -
 273
273 -
 274
274 -
 275
275 -
 276
276 -
 277
277 -
 278
278 -
 279
279
 |
 |

269
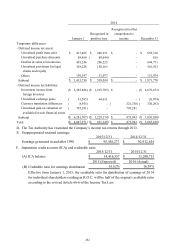
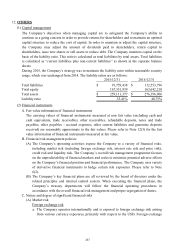
e. Net currency exchange gains (losses) (including realized and unrealized) arising from
significant foreign exchange variation on the monetary items held by the Company for
the years ended December 31, 2015 and 2014 amounted to $1,746,536 and $1,934,380,
respectively.
Price risk
a. The Company is exposed to equity securities price risk because of investments held by
the Company either as available-for-sale on stock investments or at fair value through
profit or loss. To manage its price risk arising from investments in equity securities, the
Company diversifies its portfolio. Diversification of the portfolio is done in accordance
with the limits set by the Company.
b. The prices of the Company’s investments in equity securities would change due to the
change of the future value of investee companies. If the prices of these equity securities
had increased by 1% with all other variables held constant, non-operating revenue for
the years ended December 31, 2015 and 2014 would have increased by $658 and $0,
respectively. Other comprehensive income - unrealized gain on valuation of
available-for-sale financial assets would have increased by $521,027 and $544,761,
respectively. The Company is exposed to equity securities price risk because of
investments held by the Company classified on the separate balance sheets either as
available-for-sale or at fair value through profit or loss. The Company has no price risk
of merchandise inventories. To manage its price risk arising from investments in equity
securities, the Company diversifies its portfolio. Diversification of the portfolio is done
in accordance with the limits set by the Company.
Interest rate risk
The Company analyses its interest rate exposure on a dynamic basis. Various scenarios are
simulated taking into consideration refinancing, renewal of existing positions, alternative
financing and hedging. Based on these scenarios, the Company calculates the impact on
profit and loss of a defined interest rate shift. For each simulation, the same interest rate
shift is used for all currencies. The scenarios are run only for liabilities that represent the
major interest-bearing positions. The Company expects no significant interest rate risk .
Credit risk
a. Credit risk refers to the risk of financial loss to the Company arising from default by the
clients or counterparties of financial instruments on the contract obligations. The
maximum exposure to credit risk is the carrying amount of all financial instruments.
According to the Company’s credit policy, each local entity in the Company is
responsible for managing and analysing the credit risk for each of their new clients
before standard payment and delivery terms and conditions are offered. Internal risk
control assesses the credit quality of the customers, taking into account their financial
position, past experience and other factors. Individual risk limits are set by the board of
directors based on internal or external ratings. The utilization of credit limits is regularly