Asus 2015 Annual Report Download - page 162
Download and view the complete annual report
Please find page 162 of the 2015 Asus annual report below. You can navigate through the pages in the report by either clicking on the pages listed below, or by using the keyword search tool below to find specific information within the annual report.-
 1
1 -
2
-
3
-
4
-
5
-
6
-
7
-
8
-
9
-
10
-
11
-
12
-
13
-
14
-
15
-
16
-
17
-
18
-
19
-
20
-
21
-
22
-
23
-
24
-
25
-
26
-
27
-
28
-
29
-
30
-
31
-
32
-
33
-
34
-
35
-
36
-
37
-
38
-
39
-
40
-
41
-
42
-
43
-
44
-
45
-
46
-
47
-
48
-
49
-
50
-
51
-
52
-
53
-
54
-
55
-
56
-
57
-
58
-
59
-
60
-
61
-
62
-
63
-
64
-
65
-
66
-
67
-
68
-
69
-
70
-
71
-
72
-
73
-
74
-
75
-
76
-
77
-
78
-
79
-
80
-
81
-
82
-
83
-
84
-
85
-
86
-
87
-
88
-
89
-
90
-
91
-
92
-
93
-
94
-
95
-
96
-
97
-
98
-
99
-
100
-
101
-
102
-
103
-
104
-
105
-
106
-
107
-
108
-
109
-
110
-
111
-
112
-
113
-
114
-
115
-
116
-
117
-
118
-
119
-
120
-
121
-
122
-
123
-
124
-
125
-
126
-
127
-
128
-
129
-
130
-
131
-
132
-
133
-
134
-
135
-
136
-
137
-
138
-
139
-
140
-
141
-
142
-
143
-
144
-
145
-
146
-
147
-
148
-
149
-
150
-
151
-
 152
152 -
 153
153 -
 154
154 -
 155
155 -
 156
156 -
 157
157 -
 158
158 -
 159
159 -
 160
160 -
 161
161 -
 162
162 -
 163
163 -
 164
164 -
 165
165 -
 166
166 -
 167
167 -
 168
168 -
 169
169 -
 170
170 -
 171
171 -
 172
172 -
173
-
174
-
175
-
176
-
177
-
178
-
179
-
180
-
181
-
182
-
183
-
184
-
185
-
186
-
187
-
188
-
189
-
190
-
191
-
192
-
193
-
194
-
195
-
196
-
197
-
198
-
199
-
200
-
201
-
202
-
203
-
204
-
205
-
206
-
207
-
208
-
209
-
210
-
211
-
212
-
213
-
214
-
215
-
216
-
217
-
218
-
219
-
220
-
221
-
222
-
223
-
224
-
225
-
226
-
227
-
228
-
229
-
230
-
231
-
232
-
233
-
234
-
235
-
236
-
237
-
238
-
239
-
240
-
241
-
242
-
243
-
244
-
245
-
246
-
247
-
248
-
249
-
250
-
251
-
252
-
253
-
254
-
255
-
256
-
257
-
258
-
259
-
260
-
261
-
262
-
263
-
264
-
265
-
266
-
267
-
268
-
269
-
270
-
271
-
272
-
273
-
274
-
275
-
276
-
277
-
278
-
279
 |
 |

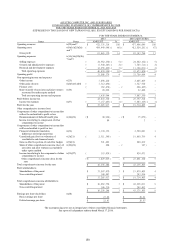
158
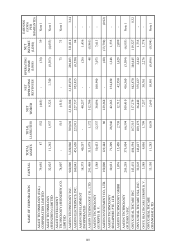
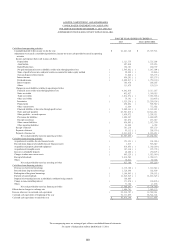
ASUSTEK COMPUTER INC. AND SUBSIDIARIES
CONSOLIDATED STATEMENTS OF COMPREHENSIVE INCOME
FOR THE YEARS ENDED DECEMBER 31, 2015 AND 2014
(EXPRESSED IN THOUSANDS OF NEW TAIWAN DOLLARS, EXCEPT EARNINGS PER SHARE DATA)
The accompanying notes are an integral part of these consolidated financial statements.
See report of independent auditors dated March 17, 2016.
FOR THE YEARS ENDED DECEMBER 31,
2015 2014 (ADJUSTED)
Items Notes AMOUNT %AMOUNT %
Operating revenues 6(22) and 7 %583-446-429 211 %588-519-15: 211
Operating costs 6(9)(16)(25)(26)
and 7
) 515-55:-:59* ) 97 * ) 523-135-372 * ) 98*
Gross profit 78-996-481 25 76-494-899 24
Operating expenses 6(13)(16)(25)(26),
7 and 9
Selling expenses )35-:93-361* ) 6* )35-713-213*) 6*
General and administrative expenses )9-:51-356* ) 3* )8-814-822*) 3*
Research and development expenses )23-:67-5::* ) 4* )22-479-122*) 3*
Total operating expenses )57-989-::5* ) 21* )54-784-935*) :*
Operating profit 32-117-487 532-81:-:75 5
Non
-operating income and expenses
Other income 6(23) 4-1:9-331 .3-516-51: 2
Other gains (losses) 6(2)(3)(11)(24) )2-423-5:5* .2-638-:31 .
Finance costs )47:-589* . ) 379-376* .
Share of profit of associates and joint ventures
accounted for under equity method
6(10) 31-7:7 . 33-597 .
Total non-operating income and expenses 2-547-:55 .4-798-661 2
Profit before income tax 33-554-431 536-4:8-625 6
Income tax expenses 6(27) )6-268-514* ) 2* )6-794-21:*) 2*
Profit for the year %28-396-:28 4 % 2:-825-516 5
Other comprehensive income (loss)
Components of other comprehensive income that
will not be reclassified to profit or loss
Remeasurements of defined benefit plan 6(16)(21) )% 51-:35* .)% 26-163* .
Income tax relating to components of other
comprehensive income
99 . 6 .
Components of other comprehensive income that
will be reclassified to profit or loss
Financial statements translation
differences of foreign operations
6(21) 2-2:5-443 . 3-671-154 2
Unrealized gain (loss) on valuation of
available-for-sale financial assets
6(3)(21) ) 3-622-651* . 2:-9:1-8:: 5
Gain on effective portion of cash flow hedges 6(5)(21) 632-574 .711-92: .
Share of other comprehensive income (loss) of
associates and joint ventures accounted for
under equity method
6(10)(21) 519 . ) 298 *.
Income tax relating to the components of other
comprehensive income
6(21)(27) ) 2:4-567* . 535-784 .
Other comprehensive income (loss) for the
year
) % 2-13:-73:* .
%
34-572-211 6
Total comprehensive income for the year %27-367-399 4 % 54-286-616 :
Profit attributable to:
Shareholders of the parent %28-1:8-581 4 % 2:-581-51: 5
Non-controlling interest 299-558 .354-::7 .
%28-396-:28 4 % 2:-825-516 5
Total comprehensive income attributable to:
Shareholders of the parent %27-17:-869 4 % 53-:37-124 :
Non-controlling interest 297-641 .35:-5:3 .
%27-367-399 4 % 54-286-616 :
Earnings per share (In dollars) 6(28)
Basic earnings per share %34/13 %37/32
Diluted earnings per share %33/94 %37/18