Asus 2015 Annual Report Download - page 190
Download and view the complete annual report
Please find page 190 of the 2015 Asus annual report below. You can navigate through the pages in the report by either clicking on the pages listed below, or by using the keyword search tool below to find specific information within the annual report.-
 1
1 -
2
-
3
-
4
-
5
-
6
-
7
-
8
-
9
-
10
-
11
-
12
-
13
-
14
-
15
-
16
-
17
-
18
-
19
-
20
-
21
-
22
-
23
-
24
-
25
-
26
-
27
-
28
-
29
-
30
-
31
-
32
-
33
-
34
-
35
-
36
-
37
-
38
-
39
-
40
-
41
-
42
-
43
-
44
-
45
-
46
-
47
-
48
-
49
-
50
-
51
-
52
-
53
-
54
-
55
-
56
-
57
-
58
-
59
-
60
-
61
-
62
-
63
-
64
-
65
-
66
-
67
-
68
-
69
-
70
-
71
-
72
-
73
-
74
-
75
-
76
-
77
-
78
-
79
-
80
-
81
-
82
-
83
-
84
-
85
-
86
-
87
-
88
-
89
-
90
-
91
-
92
-
93
-
94
-
95
-
96
-
97
-
98
-
99
-
100
-
101
-
102
-
103
-
104
-
105
-
106
-
107
-
108
-
109
-
110
-
111
-
112
-
113
-
114
-
115
-
116
-
117
-
118
-
119
-
120
-
121
-
122
-
123
-
124
-
125
-
126
-
127
-
128
-
129
-
130
-
131
-
132
-
133
-
134
-
135
-
136
-
137
-
138
-
139
-
140
-
141
-
142
-
143
-
144
-
145
-
146
-
147
-
148
-
149
-
150
-
151
-
152
-
153
-
154
-
155
-
156
-
157
-
158
-
159
-
160
-
161
-
162
-
163
-
164
-
165
-
166
-
167
-
168
-
169
-
170
-
171
-
172
-
173
-
174
-
175
-
176
-
177
-
178
-
179
-
 180
180 -
 181
181 -
 182
182 -
 183
183 -
 184
184 -
 185
185 -
 186
186 -
 187
187 -
 188
188 -
 189
189 -
 190
190 -
 191
191 -
 192
192 -
 193
193 -
 194
194 -
 195
195 -
 196
196 -
 197
197 -
 198
198 -
 199
199 -
 200
200 -
201
-
202
-
203
-
204
-
205
-
206
-
207
-
208
-
209
-
210
-
211
-
212
-
213
-
214
-
215
-
216
-
217
-
218
-
219
-
220
-
221
-
222
-
223
-
224
-
225
-
226
-
227
-
228
-
229
-
230
-
231
-
232
-
233
-
234
-
235
-
236
-
237
-
238
-
239
-
240
-
241
-
242
-
243
-
244
-
245
-
246
-
247
-
248
-
249
-
250
-
251
-
252
-
253
-
254
-
255
-
256
-
257
-
258
-
259
-
260
-
261
-
262
-
263
-
264
-
265
-
266
-
267
-
268
-
269
-
270
-
271
-
272
-
273
-
274
-
275
-
276
-
277
-
278
-
279
 |
 |

186
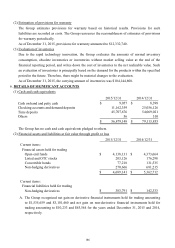
(2) Estimation of provisions for warranty
The Group estimates provisions for warranty based on historical results. Provisions for such
liabilities are recorded as costs. The Group reassesses the reasonableness of estimates of provisions
for warranty periodically.
As of December 31, 2015, provisions for warranty amounted to $12,332,740.
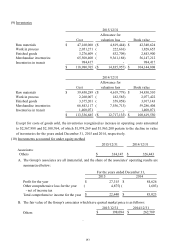
(3) Evaluation of inventories
Due to the rapid technology innovation, the Group evaluates the amounts of normal inventory
consumption, obsolete inventories or inventories without market selling value at the end of the
financial reporting period, and writes down the cost of inventories to the net realizable value. Such
an evaluation of inventories is principally based on the demand for the products within the specified
period in the future. Therefore, there might be material changes to the evaluation.
As of December 31, 2015, the carrying amount of inventories was $104,144,808.
6. DETAILS OF SIGNIFICANT ACCOUNTS
(1) Cash and cash equivalents
The Group has no cash and cash equivalents pledged to others.
(2) Financial assets and liabilities at fair value through profit or loss
A. The Group recognized net gain on derivative financial instruments held for trading amounting
to $1,535,659 and $3,101,460 and net gain on non-derivative financial instruments held for
trading amounting to $10,233 and $45,544 for the years ended December 31, 2015 and 2014,
respectively.
2015/12/31 2014/12/31
Cash on hand and petty cash 9,057$ 8,398$
Checking accounts and demand deposits 11,162,359 25,036,126
Time deposits 45,707,676 54,069,021
Others 56 310
56,879,148$ 79,113,855$
2015/12/31 2014/12/31
Current items:
Financial assets held for trading
Open-end funds 4,138,131$ 4,373,664$
Listed and OTC stocks 203,126 176,298
Convertible bonds 77,218 131,535
Non-hedging derivatives 270,666 681,215
4,689,141$ 5,362,712$
Current items:
Financial liabilities held for trading
Non-hedging derivatives 383,791$ 142,333$