Asus 2015 Annual Report Download - page 223
Download and view the complete annual report
Please find page 223 of the 2015 Asus annual report below. You can navigate through the pages in the report by either clicking on the pages listed below, or by using the keyword search tool below to find specific information within the annual report.-
 1
1 -
2
-
3
-
4
-
5
-
6
-
7
-
8
-
9
-
10
-
11
-
12
-
13
-
14
-
15
-
16
-
17
-
18
-
19
-
20
-
21
-
22
-
23
-
24
-
25
-
26
-
27
-
28
-
29
-
30
-
31
-
32
-
33
-
34
-
35
-
36
-
37
-
38
-
39
-
40
-
41
-
42
-
43
-
44
-
45
-
46
-
47
-
48
-
49
-
50
-
51
-
52
-
53
-
54
-
55
-
56
-
57
-
58
-
59
-
60
-
61
-
62
-
63
-
64
-
65
-
66
-
67
-
68
-
69
-
70
-
71
-
72
-
73
-
74
-
75
-
76
-
77
-
78
-
79
-
80
-
81
-
82
-
83
-
84
-
85
-
86
-
87
-
88
-
89
-
90
-
91
-
92
-
93
-
94
-
95
-
96
-
97
-
98
-
99
-
100
-
101
-
102
-
103
-
104
-
105
-
106
-
107
-
108
-
109
-
110
-
111
-
112
-
113
-
114
-
115
-
116
-
117
-
118
-
119
-
120
-
121
-
122
-
123
-
124
-
125
-
126
-
127
-
128
-
129
-
130
-
131
-
132
-
133
-
134
-
135
-
136
-
137
-
138
-
139
-
140
-
141
-
142
-
143
-
144
-
145
-
146
-
147
-
148
-
149
-
150
-
151
-
152
-
153
-
154
-
155
-
156
-
157
-
158
-
159
-
160
-
161
-
162
-
163
-
164
-
165
-
166
-
167
-
168
-
169
-
170
-
171
-
172
-
173
-
174
-
175
-
176
-
177
-
178
-
179
-
180
-
181
-
182
-
183
-
184
-
185
-
186
-
187
-
188
-
189
-
190
-
191
-
192
-
193
-
194
-
195
-
196
-
197
-
198
-
199
-
200
-
201
-
202
-
203
-
204
-
205
-
206
-
207
-
208
-
209
-
210
-
211
-
212
-
 213
213 -
 214
214 -
 215
215 -
 216
216 -
 217
217 -
 218
218 -
 219
219 -
 220
220 -
 221
221 -
 222
222 -
 223
223 -
 224
224 -
 225
225 -
 226
226 -
 227
227 -
 228
228 -
 229
229 -
 230
230 -
 231
231 -
 232
232 -
 233
233 -
234
-
235
-
236
-
237
-
238
-
239
-
240
-
241
-
242
-
243
-
244
-
245
-
246
-
247
-
248
-
249
-
250
-
251
-
252
-
253
-
254
-
255
-
256
-
257
-
258
-
259
-
260
-
261
-
262
-
263
-
264
-
265
-
266
-
267
-
268
-
269
-
270
-
271
-
272
-
273
-
274
-
275
-
276
-
277
-
278
-
279
 |
 |
219
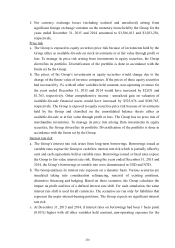
years ended December 31, 2015 and 2014 would have been $652 and $1,075 higher,
respectively, mainly as a result of higher interest expense on floating rate borrowings.
(B) Credit risk
a. Credit risk refers to the risk of financial loss to the Group arising from default by the
clients or counterparties of financial instruments on the contract obligations. The
maximum exposure to credit risk is the carrying amount of all financial instruments.
According to the Group’s credit policy, each operating entity in the Group is responsible
for managing and analysing the credit risk for each of their new clients before standard
payment and delivery terms and conditions are offered. Internal risk control assesses the
credit quality of the customers, taking into account their financial position, past
experience and other factors. Individual risk limits are set by the board of directors
based on internal or external ratings. The utilization of credit limits is regularly
monitored. Credit risk arises mainly from cash and cash equivalents, derivative financial
instruments, deposits and short-term financial products guaranteed income with banks
and financial institutions, as well as credit exposures to wholesale and retail customers,
including outstanding receivables. For banks and financial institutions, only those with a
rating of “A” class above as evaluated by an independent party are accepted as
counterparties.
b. No credit limits were exceeded during the years ended December 31, 2015 and 2014,
and the management does not expect any significant losses from non-performance by
these counterparties.
c. The credit quality information of financial assets that are neither past due nor impaired,
the ageing analysis of financial assets that were past due but not impaired and the
individual analysis of financial assets that had been impaired is provided in the
statement for each type of financial assets as described in Note 6.
(C) Liquidity risk
a. Cash flow forecasting is performed in the operating entities of the Group and aggregated
by the Group treasury. The Group treasury monitors rolling forecasts of the Group’s
liquidity requirements to ensure it has sufficient cash to meet operational needs while
maintaining sufficient headroom on its undrawn committed borrowing facilities at all
times so that the Group does not breach borrowing limits or covenants on any of its
borrowing facilities. Such forecasting takes into consideration the Group’s cash flow
plans and compliance with internal balance sheets ratio targets.
b. The Group treasury invests surplus cash in demand deposits, time deposits and
marketable securities, choosing instruments with appropriate maturities or sufficient
liquidity to provide sufficient headroom as determined by the abovementioned forecasts.
At December 31, 2015 and 2014, the Group held financial assets at fair value through
profit or loss of $4,418,475 and $4,681,497, respectively, that are expected to readily
generate cash inflows for managing liquidity risk.