Asus 2015 Annual Report Download - page 275
Download and view the complete annual report
Please find page 275 of the 2015 Asus annual report below. You can navigate through the pages in the report by either clicking on the pages listed below, or by using the keyword search tool below to find specific information within the annual report.-
 1
1 -
2
-
3
-
4
-
5
-
6
-
7
-
8
-
9
-
10
-
11
-
12
-
13
-
14
-
15
-
16
-
17
-
18
-
19
-
20
-
21
-
22
-
23
-
24
-
25
-
26
-
27
-
28
-
29
-
30
-
31
-
32
-
33
-
34
-
35
-
36
-
37
-
38
-
39
-
40
-
41
-
42
-
43
-
44
-
45
-
46
-
47
-
48
-
49
-
50
-
51
-
52
-
53
-
54
-
55
-
56
-
57
-
58
-
59
-
60
-
61
-
62
-
63
-
64
-
65
-
66
-
67
-
68
-
69
-
70
-
71
-
72
-
73
-
74
-
75
-
76
-
77
-
78
-
79
-
80
-
81
-
82
-
83
-
84
-
85
-
86
-
87
-
88
-
89
-
90
-
91
-
92
-
93
-
94
-
95
-
96
-
97
-
98
-
99
-
100
-
101
-
102
-
103
-
104
-
105
-
106
-
107
-
108
-
109
-
110
-
111
-
112
-
113
-
114
-
115
-
116
-
117
-
118
-
119
-
120
-
121
-
122
-
123
-
124
-
125
-
126
-
127
-
128
-
129
-
130
-
131
-
132
-
133
-
134
-
135
-
136
-
137
-
138
-
139
-
140
-
141
-
142
-
143
-
144
-
145
-
146
-
147
-
148
-
149
-
150
-
151
-
152
-
153
-
154
-
155
-
156
-
157
-
158
-
159
-
160
-
161
-
162
-
163
-
164
-
165
-
166
-
167
-
168
-
169
-
170
-
171
-
172
-
173
-
174
-
175
-
176
-
177
-
178
-
179
-
180
-
181
-
182
-
183
-
184
-
185
-
186
-
187
-
188
-
189
-
190
-
191
-
192
-
193
-
194
-
195
-
196
-
197
-
198
-
199
-
200
-
201
-
202
-
203
-
204
-
205
-
206
-
207
-
208
-
209
-
210
-
211
-
212
-
213
-
214
-
215
-
216
-
217
-
218
-
219
-
220
-
221
-
222
-
223
-
224
-
225
-
226
-
227
-
228
-
229
-
230
-
231
-
232
-
233
-
234
-
235
-
236
-
237
-
238
-
239
-
240
-
241
-
242
-
243
-
244
-
245
-
246
-
247
-
248
-
249
-
250
-
251
-
252
-
253
-
254
-
255
-
256
-
257
-
258
-
259
-
260
-
261
-
262
-
263
-
264
-
 265
265 -
 266
266 -
 267
267 -
 268
268 -
 269
269 -
 270
270 -
 271
271 -
 272
272 -
 273
273 -
 274
274 -
 275
275 -
 276
276 -
 277
277 -
 278
278 -
 279
279
 |
 |

271
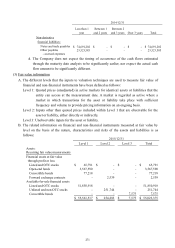
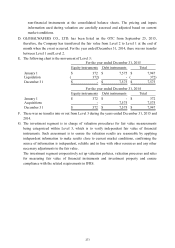
d. The Company does not expect the timing of occurrence of the cash flows estimated
through the maturity date analysis to be significantly earlier, nor expect the actual cash
flow amount to be significantly different.
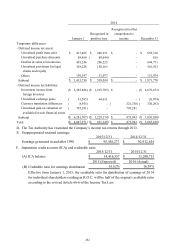
(3) Fair value information
A. The different levels that the inputs to valuation techniques are used to measure fair value of
financial and non-financial instruments have been defined as follows:
Level 1: Quoted prices (unadjusted) in active markets for identical assets or liabilities that the
entity can access at the measurement date. A market is regarded as active where a
market in which transactions for the asset or liability take place with sufficient
frequency and volume to provide pricing information on an ongoing basis.
Level 2: Inputs other than quoted prices included within Level 1 that are observable for the
asset or liability, either directly or indirectly.
Level 3: Unobservable inputs for the asset or liability.
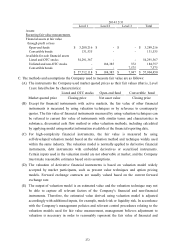
B. The related information on financial and non-financial instruments measured at fair value by
level on the basis of the nature, characteristics and risks of the assets and liabilities is as
follows:
Less than 1
year
Between 1
and 2 years
Between 2
and 3 years
Over 3 years
Total
Non-derivative
financial liabilities:
Notes and trade payables 74,691,202$ -$ -$ -$ 74,691,202$
Other payables
- accrued expenses
23,523,585 - - - 23,523,585
2014/12/31
Level 1 Level 2 Level 3 Total
Assets:
Recurring fair value measurements
Financial assets at fair value
through profit or loss
Listed and OTC stocks 65,791$ -$ -$ 65,791$
Open-end funds 3,567,590 - - 3,567,590
Convertible bonds 77,218 - - 77,218
Forward exchange contracts - 2,539 - 2,539
Available-for-sale financial assets
Listed and OTC stocks 51,850,918 - - 51,850,918
Unlisted and non-OTC stocks - 251,744 - 251,744
Convertible bonds - - 7,575 7,575
55,561,517$ 254,283$ 7,575$ 55,823,375$
2015/12/31