Asus 2015 Annual Report Download - page 189
Download and view the complete annual report
Please find page 189 of the 2015 Asus annual report below. You can navigate through the pages in the report by either clicking on the pages listed below, or by using the keyword search tool below to find specific information within the annual report.-
 1
1 -
2
-
3
-
4
-
5
-
6
-
7
-
8
-
9
-
10
-
11
-
12
-
13
-
14
-
15
-
16
-
17
-
18
-
19
-
20
-
21
-
22
-
23
-
24
-
25
-
26
-
27
-
28
-
29
-
30
-
31
-
32
-
33
-
34
-
35
-
36
-
37
-
38
-
39
-
40
-
41
-
42
-
43
-
44
-
45
-
46
-
47
-
48
-
49
-
50
-
51
-
52
-
53
-
54
-
55
-
56
-
57
-
58
-
59
-
60
-
61
-
62
-
63
-
64
-
65
-
66
-
67
-
68
-
69
-
70
-
71
-
72
-
73
-
74
-
75
-
76
-
77
-
78
-
79
-
80
-
81
-
82
-
83
-
84
-
85
-
86
-
87
-
88
-
89
-
90
-
91
-
92
-
93
-
94
-
95
-
96
-
97
-
98
-
99
-
100
-
101
-
102
-
103
-
104
-
105
-
106
-
107
-
108
-
109
-
110
-
111
-
112
-
113
-
114
-
115
-
116
-
117
-
118
-
119
-
120
-
121
-
122
-
123
-
124
-
125
-
126
-
127
-
128
-
129
-
130
-
131
-
132
-
133
-
134
-
135
-
136
-
137
-
138
-
139
-
140
-
141
-
142
-
143
-
144
-
145
-
146
-
147
-
148
-
149
-
150
-
151
-
152
-
153
-
154
-
155
-
156
-
157
-
158
-
159
-
160
-
161
-
162
-
163
-
164
-
165
-
166
-
167
-
168
-
169
-
170
-
171
-
172
-
173
-
174
-
175
-
176
-
177
-
178
-
 179
179 -
 180
180 -
 181
181 -
 182
182 -
 183
183 -
 184
184 -
 185
185 -
 186
186 -
 187
187 -
 188
188 -
 189
189 -
 190
190 -
 191
191 -
 192
192 -
 193
193 -
 194
194 -
 195
195 -
 196
196 -
 197
197 -
 198
198 -
 199
199 -
200
-
201
-
202
-
203
-
204
-
205
-
206
-
207
-
208
-
209
-
210
-
211
-
212
-
213
-
214
-
215
-
216
-
217
-
218
-
219
-
220
-
221
-
222
-
223
-
224
-
225
-
226
-
227
-
228
-
229
-
230
-
231
-
232
-
233
-
234
-
235
-
236
-
237
-
238
-
239
-
240
-
241
-
242
-
243
-
244
-
245
-
246
-
247
-
248
-
249
-
250
-
251
-
252
-
253
-
254
-
255
-
256
-
257
-
258
-
259
-
260
-
261
-
262
-
263
-
264
-
265
-
266
-
267
-
268
-
269
-
270
-
271
-
272
-
273
-
274
-
275
-
276
-
277
-
278
-
279
 |
 |

185
arrangement. All acquisition-related costs are expensed as incurred. Identifiable assets
acquired and liabilities and contingent liabilities assumed in a business combination are
measured initially at their fair values at the acquisition date. For each business combination,
the Group measures at the acquisition date components of non-controlling interests in the
acquiree that are present ownership interests and entitle their holders to the proportionate
share of the entity’s net assets in the event of liquidation at either fair value or the present
ownership instruments’ proportionate share in the recognized amounts of the acquiree’s
identifiable net assets. All other non-controlling interests should be measured at the
acquisition-date fair value.
B. If the total of the fair values of the consideration of acquisition and any non-controlling
interest in the acquiree as well as the acquisition-date fair value of any previous equity
interest in the acquiree is higher than the fair value of the Group’s share of the identifiable net
assets acquired and liabilities assumed, the difference is recorded as goodwill, if the total of
the fair values of the consideration of acquisition and any non-controlling interest in the
acquiree as well as the acquisition-date fair value of any previous equity interest in the
acquiree is higher than the fair value of the Group’s share of the identifiable net assets
acquired and liabilities assumed, the difference is recorded as profit.
(33) Operating segments
Operating segments are reported in a manner consistent with the internal management reports
provided to the chief operating decision-maker. The chief operating decision-maker is responsible
for allocating resources and assessing performance of the operating segments.
5. CRITICAL ACCOUNTING JUDGEMENTS, ESTIMATES AND KEY SOURCES OF
ASSUMPTION UNCERTAINTY
The preparation of these consolidated financial statements requires management to make critical
judgements in applying the Group’s accounting policies and make critical assumptions at the end of the
financial reporting period and estimates concerning future events. The resulting accounting estimates
and assumptions might be different from the actual results, and will be continually evaluated and
adjusted based on historical experience and other factors; and the related information is addressed
below:
Critical accounting estimates and assumptions:
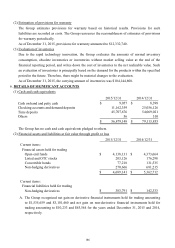
(1) Estimation of sales returns and discounts
The Group estimates discounts and returns based on historical results and other known factors.
Provisions for such liabilities are recorded as a deduction item to sales revenues when the sales are
recognized. The Group reassesses the reasonableness of estimates of discounts and returns
periodically.
As of December 31, 2015, provisions for discounts and sales returns amounted to $17,910,712.