Asus 2015 Annual Report Download - page 227
Download and view the complete annual report
Please find page 227 of the 2015 Asus annual report below. You can navigate through the pages in the report by either clicking on the pages listed below, or by using the keyword search tool below to find specific information within the annual report.-
 1
1 -
2
-
3
-
4
-
5
-
6
-
7
-
8
-
9
-
10
-
11
-
12
-
13
-
14
-
15
-
16
-
17
-
18
-
19
-
20
-
21
-
22
-
23
-
24
-
25
-
26
-
27
-
28
-
29
-
30
-
31
-
32
-
33
-
34
-
35
-
36
-
37
-
38
-
39
-
40
-
41
-
42
-
43
-
44
-
45
-
46
-
47
-
48
-
49
-
50
-
51
-
52
-
53
-
54
-
55
-
56
-
57
-
58
-
59
-
60
-
61
-
62
-
63
-
64
-
65
-
66
-
67
-
68
-
69
-
70
-
71
-
72
-
73
-
74
-
75
-
76
-
77
-
78
-
79
-
80
-
81
-
82
-
83
-
84
-
85
-
86
-
87
-
88
-
89
-
90
-
91
-
92
-
93
-
94
-
95
-
96
-
97
-
98
-
99
-
100
-
101
-
102
-
103
-
104
-
105
-
106
-
107
-
108
-
109
-
110
-
111
-
112
-
113
-
114
-
115
-
116
-
117
-
118
-
119
-
120
-
121
-
122
-
123
-
124
-
125
-
126
-
127
-
128
-
129
-
130
-
131
-
132
-
133
-
134
-
135
-
136
-
137
-
138
-
139
-
140
-
141
-
142
-
143
-
144
-
145
-
146
-
147
-
148
-
149
-
150
-
151
-
152
-
153
-
154
-
155
-
156
-
157
-
158
-
159
-
160
-
161
-
162
-
163
-
164
-
165
-
166
-
167
-
168
-
169
-
170
-
171
-
172
-
173
-
174
-
175
-
176
-
177
-
178
-
179
-
180
-
181
-
182
-
183
-
184
-
185
-
186
-
187
-
188
-
189
-
190
-
191
-
192
-
193
-
194
-
195
-
196
-
197
-
198
-
199
-
200
-
201
-
202
-
203
-
204
-
205
-
206
-
207
-
208
-
209
-
210
-
211
-
212
-
213
-
214
-
215
-
216
-
 217
217 -
 218
218 -
 219
219 -
 220
220 -
 221
221 -
 222
222 -
 223
223 -
 224
224 -
 225
225 -
 226
226 -
 227
227 -
 228
228 -
 229
229 -
 230
230 -
 231
231 -
 232
232 -
 233
233 -
 234
234 -
 235
235 -
 236
236 -
 237
237 -
238
-
239
-
240
-
241
-
242
-
243
-
244
-
245
-
246
-
247
-
248
-
249
-
250
-
251
-
252
-
253
-
254
-
255
-
256
-
257
-
258
-
259
-
260
-
261
-
262
-
263
-
264
-
265
-
266
-
267
-
268
-
269
-
270
-
271
-
272
-
273
-
274
-
275
-
276
-
277
-
278
-
279
 |
 |

223
instruments, debt instruments with embedded derivatives or securitised instruments.
Certain inputs used in the valuation model are not observable at market, and the Group
must make reasonable estimates based on its assumptions.
(D) The valuation of derivative financial instruments is based on valuation model widely
accepted by market participants, such as present value techniques and option pricing
models. Forward exchange contracts are usually valued based on the current forward
exchange rate.
(E) The output of valuation model is an estimated value and the valuation technique may not
be able to capture all relevant factors of the Group’s financial and non-financial
instruments. Therefore, the estimated value derived using valuation model is adjusted
accordingly with additional inputs, for example, model risk or liquidity risk. In accordance
with the Group’s management policies and relevant control procedures relating to the
valuation models used for fair value measurement, management believes adjustment to
valuation is necessary in order to reasonably represent the fair value of financial and
non-financial instruments at the consolidated balance sheets. The pricing and inputs
information used during valuation are carefully assessed and adjusted based on current
market conditions.
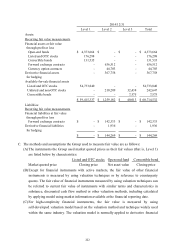
D. GLOBALWAFERS CO., LT D . has been listed on the OTC from September 25, 2015, therefore,
the Group has transferred the fair value from Level 2 to Level 1 at the end of month when the
event occurred. For the year ended December 31, 2014, there was no transfer between Level 1
and Level 2.
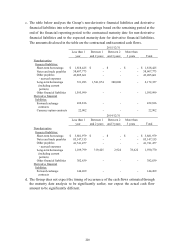
E. The following chart is the movement of Level 3:
Equity instruments
Debt instruments Total
January 1 32,438$ 7,575$ 40,013$
Gains (losses) recognized in net other 1,434 - 1,434
comprehensive income (loss) (Note 2)
Disposals 5,152)( - 5,152)(
Liquidation 589)( - 589)(
December 31 28,131$ 7,575$ 35,706$
For the year ended December 31, 2015